In our understanding of global geothermal heat flow, Greenland and the surrounding ocean floor has effectively been a blind spot. Now, scientist have dug up all available and somewhat unavailable heat flow data, creating common ground for working with Greenland geothermal heat as an alternative energy source, a factor in melting of the ice cap and much more.
As it turns out, that the ground beneath Greenland is even colder than previously thought. This is one of the conclusions of a paper just published in Earth System Science Data by an international team of scientists lead by the Geological Survey of Denmark and Greenland (GEUS).
The researchers have compiled a new database and heat flow model consisting of all available geothermal heat flow data for the region. This involved a large amount of digging through “gray literature,” or observations not previously included in data scarce Arctic heat flow models. The researchers used this observation database to make a new spatial map of heat flow in and around Greenland.
The new heat flow model, created with machine learning, shows that the mean heat flow on land is 44 mW/ m2 (milli Watt, meaning a thousandth of a Watt, per square meter). Which is substantially lower than what previous models have estimated. These models are based on significantly less data than the newly published one, in which 129 new measurements are included for a total of 419 measurements. For some of the previous heat flow models, the mean geothermal heat flow per unit was several times that of the newly published estimate.
Hotpots for geothermal energy
Even though the mean heat flow across Greenland was colder than previously estimated, the heat flow in coastal areas that have “recently” emerged from the ocean was in fact much warmer that expected. This might be good news for the populations here.
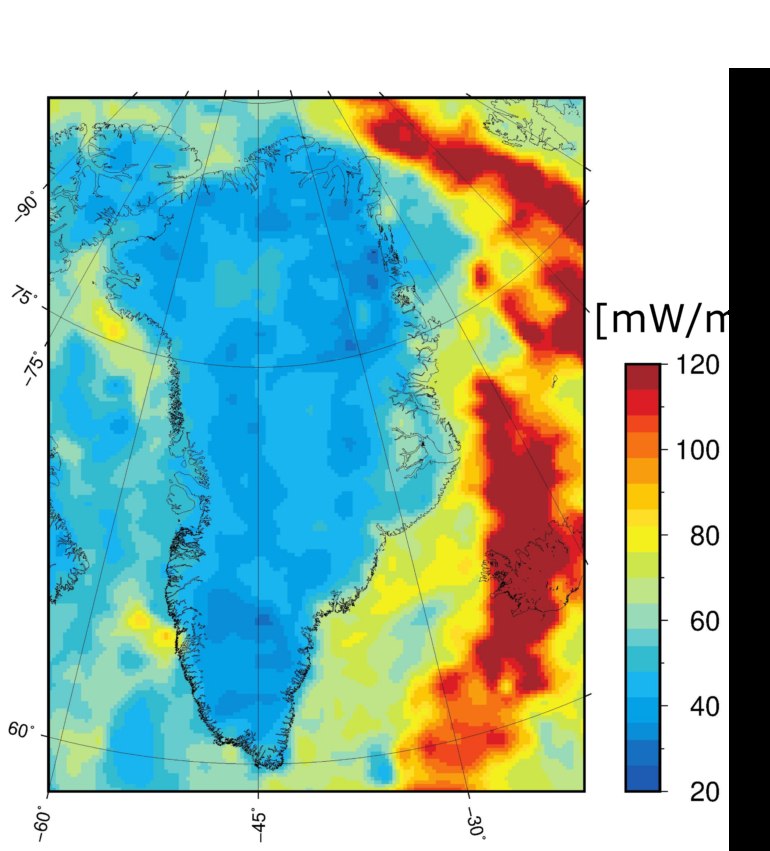
“Actually, this area along the west coast of Greenland has three times the heat flow as further inland, so it makes sense to investigate the possibility of harvesting the geothermal energy for the communities located there,” says lead author and senior scientist William Colgan from the Department of Glaciology and Climate at GEUS.

Overview of site locations and types in the heat flow measurement database. Yellow dots denote sites where we reassess heat flow values presented in International Heat Flow Commission 2018 or other studies. Dashed line denotes our study boundary, 500 km from Greenland’s coasts. The Meighen and Barnes Ice Caps lie outside this boundary, but we still report these subglacial measurements here. © . © Colgan and Wansing, 2022
A dynamic area
According to William Colgan, this makes it clear just how much we still don’t know about the region.
“This area is a geothermal freak zone for sure. You have this really old, stable, North Atlantic Craton in the south of Greenland that’s quite cool, and just next to it is the Mid Atlantic Ridge and Iceland with all its volcanic activity. Not to mention the influence of the ice sheet. All of this makes for a geothermally weird region, which is really a bit different from the rest of the world. And therefore, important to understand.”
The geothermal heat flow seeming to be lower than anticipated does not change the rate at which the ice sheet is melting, he adds. Much of today’s melt reflects recent warming the ice-atmosphere and ice-ocean boundaries. The geothermal heat flow at the ice-lithosphere boundary is not changing quickly, but it is important for understanding stability of the ice sheet at the ice-bed interface.
‘Might as well do the ocean’
Initially, William Colgan and his colleagues became interested in the geothermal heat flow because of its role in the dynamics of the melting ice sheet. Searching for heat flow data from the Greenland area, it quickly became clear that this was a somewhat underdeveloped area. Or at least disorganized.
“There’s actually been a range of different players collecting geothermal heat flow data in and around Greenland through time, but all with individual uses. Like, the oil and gas companies have collected some data to help locate pockets of gas and oil below ground. There’s also the permafrost and glaciology fields who use heat flow as an important boundary condition in their models. More or less everybody in geosciences uses heat flow in some sense, but no one has evidently felt the need for compiling a comprehensive overview until now, I guess.”

Example of a borehole supplying heat flow data in Greenland drilled just off the ice sheet close to Point 660 with the Isunnguata Sermia outlet glacier as backdrop. © Lillemor Claesson Liljedahl
While trying to locate good locations to retrieve new geothermal heat flow data, William Colgan and his colleagues had to find out where data had already been collected. The more they talked to researchers from other research fields, the more untapped data was uncovered.
“At first we were looking for just sub-glacial heat flow data, then we got into data from the sub-aerial, or tundra, areas and at last we thought ‘well, we might as well do the ocean’ and cover the whole region,” he says.
16 institutions, eight countries
Thus, it turned into an endeavor expanding from the original team of GEUS glaciologists into a range of researchers from different disciplines located in 16 institutions in eight different countries. A joint effort resulting in the new geothermal heat flow model being the first that includes all available offshore and onshore data, including below the ice sheet, in Greenland.

Of course, even with 419 data points now registered for the area, the data coverage is still very small for an area as large as Greenland. Greenland has a diversity of geologic provinces and physical processes that contribute to substantial spatial variations in heat flow, as second-author and doctoral researcher at the Institute of Geosciences from Kiel University Agnes Wansing points out:
“Especially for the inland part of Greenland only a few data points exist and how they are treated in the machine learning can substantially change the model prediction.”
To enhance data coverage, the team is currently investigating the possibility of acquiring a heat probe to drop off the back of research vessels going on field work in the Arctic.
“Then we could continue to fill in the map, which is still looking kind of scarce,” the lead author says.
More information:
William Colgan et al, Greenland Geothermal Heat Flow Database and Map (Version 1), Earth System Science Data (2022). DOI: 10.5194/essd-14-2209-2022
The in-situ measurement database and gridded heat flow model, as well as other supporting materials, are freely available from the GEUS Dataverse. DOI: 10.22008/FK2/F9P03L
Citation:
Mapping heat flow beneath Greenland highlights geothermal ‘freak zone’ (2022, May 13)

