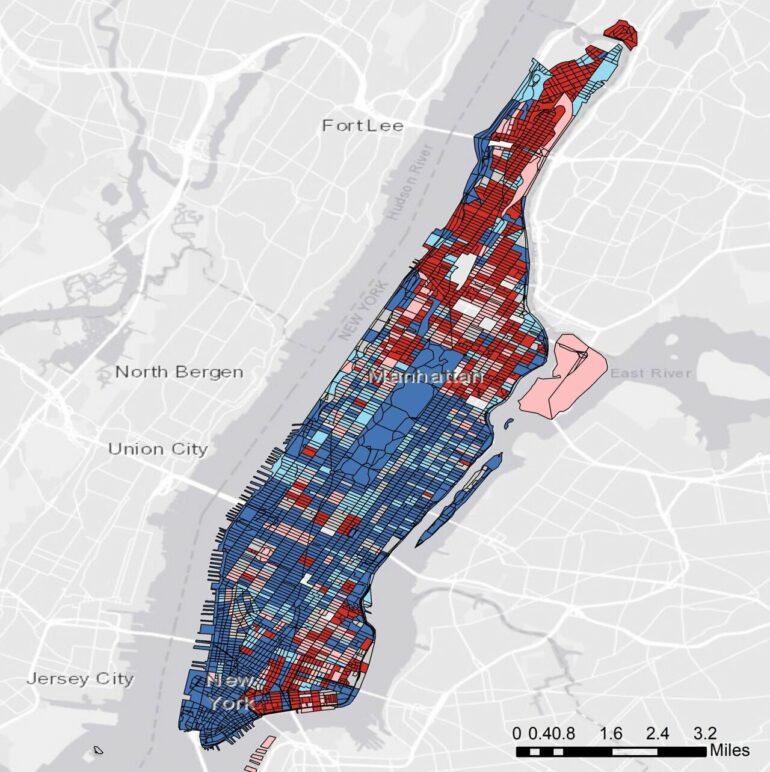
A fifth of neighborhood blocks in the continental United States most vulnerable to natural disaster account for a quarter of the lower 48 states’ risk, according to a detailed assessment of vulnerability.
Leaders in data-driven risk modeling, researchers at The University of Alabama used advanced data analysis and machine learning of more than 100 factors that influence vulnerability to natural hazards for about 11 million United States Census Bureau blocks, finding significant differences can exist between neighboring blocks.
The result published in the journal Nature Communications is the first mapping of the continental U.S.’s exposure to impacts from natural hazards at the block level, overcoming the limitations of previous efforts to define and assess vulnerability at larger scales that can hide local variability.
The detailed data, called the Social, Economic, Infrastructure Vulnerability Index, has the potential to play a key role in effective risk management and provide crucial information for enhanced risk-informed decision making.
“The SEIV Index locates communities and neighborhoods with an immediate need to consider implementing risk mitigation measures and bottom-up approaches for adaptation,” said Dr. Hamid Moradkhani, the Alton N. Scott professor of Civil and Environmental Engineering and director of the UA Center for Complex Hydrosystems Research. “Such fine resolution assessment help to determine the relative urgency of action and resource allocation for improved resiliency.”
With natural hazards becoming more frequent and intense, the UA team of researchers wanted to create a comprehensive assessment of vulnerability across the country that considered a wide range of factors influencing risk. Researchers also wanted to reduce subjectivity in assessing vulnerability.
Performing an analysis of reported property damage costs, the UA researchers used machine learning to weigh variables that contribute to an area’s vulnerability to natural disasters. Honing in to the block level combined socio-economic factors with infrastructural characteristics of communities such as distance to nearest emergency facilities and building count. The approach overcame broad, national-level efforts to understand similar problems, but would miss unequal vulnerability between neighboring blocks to the same disaster.
“Natural hazards disproportionately affect communities around the Conterminous United States,” Moradkhani said.
Among the top 10 states with the highest percentage of blocks with a high vulnerability to natural disasters are two states in the top 10 of largest gross domestic product, a measurement of a state’s economic output. Minnesota with 82% of its Census blocks with high or very high SEIV indices, second highest among the 48 states in the study, and Ohio with 76% of its Census block highly vulnerable, third highest, are both in the top 10 for state GDP.
These two examples show that aggregate information can mask inequality and hide local vulnerability to natural disasters, Moradkhani said.
“Our main motivation was to develop a new vulnerability index that covers the entire continental U.S. and provide high resolution information at block level with consideration of socio-economic and infrastructure vulnerability metrics,” he said. “This provides an objective approach to inform public, emergency managers and stakeholders to develop adaptive capacities and prepare more resilient communities in their jurisdictions.”
More information:
Farnaz Yarveysi et al, Block-level vulnerability assessment reveals disproportionate impacts of natural hazards across the conterminous United States, Nature Communications (2023). DOI: 10.1038/s41467-023-39853-z
Provided by
University of Alabama in Tuscaloosa
Citation:
Natural hazard vulnerability shows disproportionate risk across the US: New data analysis (2023, July 18)


