The deadly flash flooding in Texas on July 4, 2025, and destructive flash floods a week later in states including New Mexico, Vermont and Iowa are raising questions about the nation’s flood maps and their ability to ensure that communities and homeowners can prepare for rising risks.
The U.S. Federal Emergency Management Agency’s flood maps are intended to be the nation’s primary tool for identifying flood risks. Originally developed in the 1970s to support the National Flood Insurance Program, these maps, known as Flood Insurance Rate Maps, or FIRMs, are used to determine where flood insurance is required for federally backed mortgages, to inform local building codes and land-use decisions, and to guide flood plain management strategies.
In theory, the maps enable homeowners, businesses and local officials to understand their flood risk and take appropriate steps to prepare and mitigate potential losses.
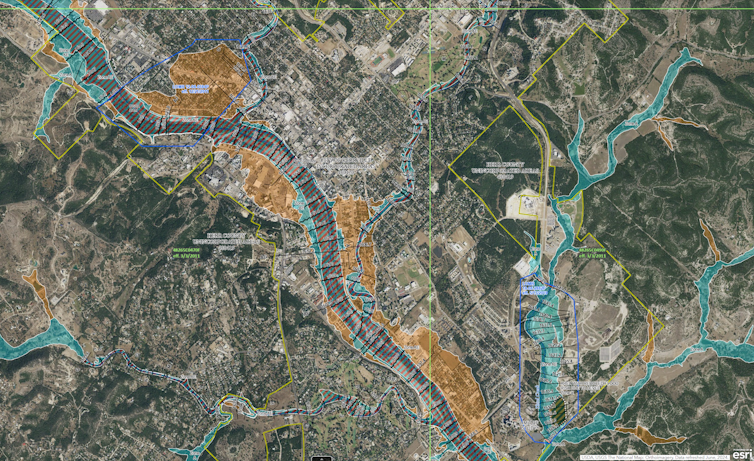
A federal flood map of Kerrville, Texas, with the Guadalupe River winding through the middle in purple, shows areas considered to have a 1% annual chance of flooding in blue and a 0.2% annual chance of flooding in tan. During a flash flood on July 4, 2025, the river rose more than 30 feet at Kerrville.
FEMA
But while FEMA has improved the accuracy and accessibility of the maps over time with better data, digital tools and community input, the maps still don’t capture everything – including the changing climate. There are areas of the country that flood, some regularly, that don’t show up on the maps as at risk.
I study flood-risk mapping as a university-based researcher and at First Street, an organization created to quantify and communicate climate risk. In a 2023 assessment using newly modeled flood zones with climate-adjusted precipitation records, we found that more than twice as many properties across the country were at risk of a 100-year flood than the FEMA maps identified.
Even in places where the FEMA maps identified a flood risk, we found that the federal mapping process, its overreliance on historical data, and political influence over the updating of maps can lead to maps that don’t fully represent an area’s risk.
What FEMA flood maps miss
FEMA’s maps are essential tools for identifying flood risks, but they have significant gaps that limit their effectiveness.

One major limitation is that they don’t consider flooding driven by intense bursts of rain. The maps primarily focus on river channels and coastal flooding, largely excluding the risk of flash flooding, particularly along smaller waterways such as streams, creeks and tributaries.
This limitation has become more important in recent years due to climate change. Rising global temperatures can result in more frequent extreme downpours, leaving more areas vulnerable to flooding, yet unmapped by FEMA.


