by Nail F. Bashan
When I moved to Boston for my Ph.D., I quickly noticed how little reliable data we actually have about how people move around cities. We talk about “car dependence,” “walkable neighborhoods” or “transit equity,” but the evidence often comes from self-reported surveys last updated a decade ago. Most of those surveys rely on memory: people are asked to recall every trip they made yesterday. As you can imagine, that kind of data misses a lot.
That realization motivated me—and my colleagues at Northeastern University and MIT—to create something different: a modern, smartphone-based travel survey that could record people’s movements automatically and reveal the real rhythm of urban mobility. We called it the BostonWalks Study.
Rethinking how we measure movement
Smartphones have become powerful sensors of daily life. They know when we start walking, when we get on the bus, when we stop for coffee. By using the phone’s GPS and motion sensors—with consent and strict privacy safeguards—we can capture detailed, second-by-second traces of where people actually travel, instead of where they think they went.
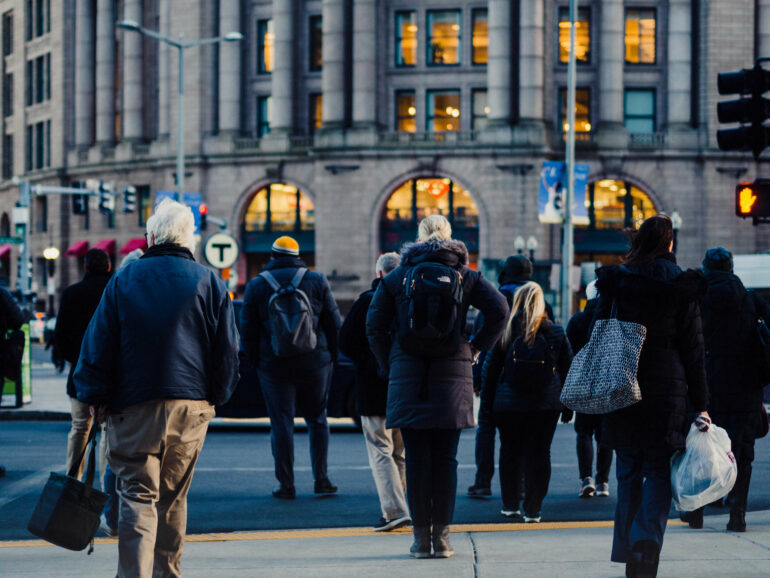
In 2023, we recruited nearly a thousand residents from across the Boston metropolitan area. Each participant installed a tracking app and carried it for at least two weeks, though many stayed in the study for over a month. The result was one of the most comprehensive datasets of its kind in North America: more than 155,000 trips from 990 participants covering walking, biking, transit, and driving.
The study, now published in the journal Transportation, also included an extensive questionnaire about age, income, race, and household characteristics—so that we could understand who travels in which ways, and whether some groups are under- or over-represented in the transportation data that planners use every day.
What we discovered
Traditional surveys have long undercounted short trips, especially those made on foot. Our data revealed that walking actually accounts for about 21% of all trips in Boston—roughly 10 times higher than the share reported in previous household surveys. Subway trips also made up a much larger proportion, reflecting the dense, transit-rich fabric of the city’s core.
Income, we found, shapes travel in surprising ways. Higher-income participants tended to live in central, walkable neighborhoods and walked or biked longer distances. Lower-income participants relied more heavily on public transit but often faced longer and less convenient commutes. We also observed clear spatial patterns: car-focused travelers clustered in suburban ZIP codes, while bike and walk enthusiasts lived in denser, downtown areas.
These findings highlight that mobility choices are not just personal preferences—they’re deeply tied to geography, infrastructure, and inequality. Access to frequent transit or safe bike routes isn’t distributed evenly, and data like ours can make those disparities visible.
The challenge of building trust
Collecting sensitive location data required care. Every participant had to provide informed consent, and all information was encrypted and anonymized. We stored data on secure servers and gave participants full control to withdraw at any time.
Recruiting people, however, turned out to be harder than building the technology. We began by contacting community organizations but quickly realized that outreach alone wasn’t enough. With support from the Massachusetts Bay Transportation Authority, we placed posters in subway stations—those familiar orange-and-white signs that commuters see every day. That campaign reached an estimated 6 million people and helped us reach our target sample.
Still, certain groups remained underrepresented, such as older adults and residents without smartphones. Future surveys may need to combine app-based tracking with mailed diaries or community partnerships to ensure that everyone’s mobility is counted.
Why this matters
Accurate mobility data is essential for fair and sustainable city planning. If we underestimate walking and biking, we undervalue investments in sidewalks, shade trees, or protected lanes. If we ignore the long transit commutes of low-income households, we risk widening inequities.
BostonWalks shows that it’s possible to collect rich, real-world travel data at a fraction of the cost of traditional surveys—our entire study ran on a budget under $50,000. The dataset is now openly available for researchers and planners who want to explore questions of transportation equity, emissions, and accessibility.

For me, the most rewarding part has been seeing how data can empower local policy. Cities everywhere are trying to reduce car dependence, cut carbon emissions, and design streets that prioritize people over vehicles. But to change what we build, we first need to understand how people actually move. With tools like smartphone tracking, that understanding is finally within reach.
This story is part of Science X Dialog, where researchers can report findings from their published research articles. Visit this page for information about Science X Dialog and how to participate.
More information:
Adrian Meister et al, The BostonWalks study: a longitudinal travel survey using smartphone tracking, Transportation (2025). DOI: 10.1007/s11116-025-10637-2. link.springer.com/article/10.1 … 7/s11116-025-10637-2
Nail F. Bashan is a Ph.D. candidate in Civil & Environmental Engineering at Northeastern University. His research focuses on human mobility, urban informatics, and environmental exposure. He leads data analytics for the BostonWalks Project, developing new methods to integrate smartphone tracking, GIS, and equity modeling for sustainable transportation planning.
Citation:
How smartphones are helping us understand how people really move through cities (2025, October 16)

