Before DESI, the Dark Energy Spectroscopic Instrument, can begin its 5-year mission from an Arizona mountaintop to produce the largest 3-D sky map yet, researchers first needed an even bigger 2-D map of the universe.
The 2-D map, pieced together from 200,000 telescope images and several years of satellite data, lacks information about galaxy distances, and DESI will supply this and provide other useful details by measuring the color signatures and “redshift” of galaxies and quasars in its survey. Objects’ redder colors provide telltale information about their distance from Earth and about how quickly they are moving away from us—and this phenomenon is known as redshift.
In the end, this 2-D map of the universe is the largest ever, based on the area of sky covered, its depth in imaging faint objects, and its more than 1 billion galaxy images.
The ambitious, 6-year effort to capture images and stitch them together for this 2-D map—which involved 1,405 observing nights at three telescopes on two continents and years of data from a space satellite, an upgraded camera to image incredibly faint and distant galaxies, 150 observers and 50 other researchers from around the world. The effort also required 1 petabyte of data—enough to store 1 million movies—and 100 million CPU hours at Berkeley Lab’s National Energy Research Scientific Computing Center (NERSC).
2-D map sets the stage for DESI observations, with a goal to solve dark energy mystery
“This is the biggest map by almost any measure,” said David Schlegel, co-project scientist for DESI who led the imaging project, known as the DESI Legacy Imaging Surveys. Schlegel is a cosmologist at the U.S. Department of Energy’s Lawrence Berkeley National Laboratory (Berkeley Lab), which is the lead institution for the international DESI collaboration.
The map covers half of the sky, and digitally sprawls over 10 trillion pixels, which is equivalent to a mosaic of 833,000 high-res smartphone photos. The DESI collaboration has about 600 participating scientists from 54 institutions around the world.
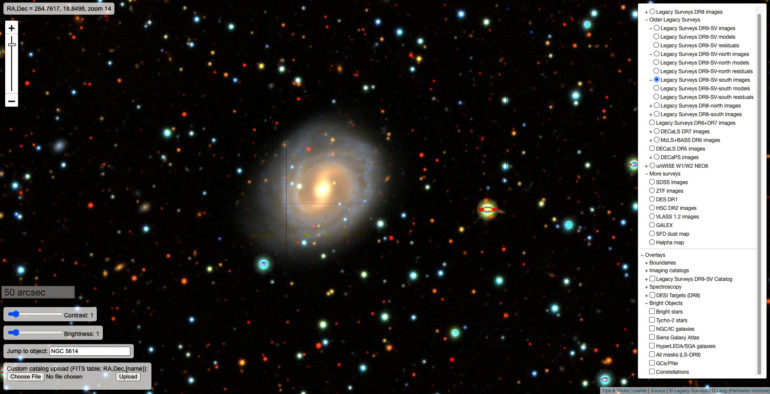
Publicly viewable at legacysurvey.org/viewer, the Sky Viewer map includes 2 billion objects—more than half of which are galaxies—and numerous clickable filters to select from specific object types or surveys. Some of the objects are individually labeled, and viewers can choose to display constellations, for example, and galaxies and quasars that will be imaged by DESI. Quasars are among the brightest objects in the universe, with supermassive black holes at their center that emit powerful jets of matter.
DESI is equipped with an array of 5,000 swiveling, automated robots, each toting a thin fiber-optic cable that will be pointed at individual objects. These cables will gather the light from 35 million galaxies and 2.4 million quasars during the five years of DESI observations.
The primary purpose of compiling the 2-D map data is to identify these galaxy and quasar targets for DESI, which will measure their light to pinpoint their redshift and distance. This will ultimately provide new details about mysterious dark energy that is driving the universe’s accelerating expansion.
Nathalie Palanque-Delabrouille, DESI co-spokesperson and a cosmologist at the French Alternative Energies and Atomic Energy Commission (CEA), noted that the expansion rate has evolved, and there are many unanswered questions about the changes in this rate.
“Our universe had a surprising history,” she explained. “During the first half of its life, its expansion was driven mostly by the dark matter it contains.” Dark matter is unknown matter, making up 85 percent of all matter in the universe and so far only observed indirectly through its gravitational effects on normal matter.
“However, in the past 7 billion years the expansion of our universe has been gradually accelerating under the influence of a mysterious dark energy,” she added, “and the goal of DESI is to precisely clarify this overall picture by unveiling what dark energy is.”
Palanque-Delabrouille has been involved in the effort to pick targets for DESI to observe from the surveys’ data. She noted that DESI will gather light from a mix of galaxies at several distances, including bright galaxies that are within 4 billion light years of Earth, so-called red galaxies that allow us to see back to 8 billion years ago, very young blue galaxies or “emission-line” galaxies that will go further back 10 billion years ago, and ultimately quasars, which are so bright they can be seen up to 12 billion light-years away.
“Having managed to collect and process these imaging data is really a major achievement. DESI wouldn’t be getting anywhere without such large imaging surveys,” she said.
Software guides observing plan, and standardizes and stitches imaging data
Piecing together all of the DESI surveys’ images to create a seamless sky map was no trivial task, Schlegel explained. “One of the goals is to get a really uniform image by stitching together multiple observations,” he said. “We started out scattershot. And cameras do have gaps—they miss stuff. Part of the challenge here was planning the observing program so that you could fill in all of the gaps—that was a huge logistical challenge. You have to make sure it is as homogeneous as possible.”
The three surveys that comprise the DESI Legacy Imaging Surveys conducted imaging in three different colors, and each survey took three separate images of the same sky areas to ensure complete coverage. This new, ground-based imaging data was also supplemented by imaging data from NASA’s Wide-field Infrared Survey Explorer (WISE) satellite mission, which collected space images in four bands of infrared light.
For the Legacy Imaging Surveys’ data-taking effort, Schlegel designed a code, improved over time, that helped to calculate the best approach and timing for capturing the best images to completely cover half of the sky, considering hours of darkness, weather, exposure time, planetary and satellite paths, and moon brightness and location, among other variables.
Dustin Lang, DESI imaging scientist at the Perimeter Institute for Theoretical Physics in Canada, played a key role in standardizing all of the imaging data from ground- and sky-based surveys and stitching it together.
In some images, Lang noted, “the sky might be really stable and calm,” while on another night “we might have light clouds or just a turbulent atmosphere that causes blurring in the images.” His challenge: to develop software that recognized the good data without diluting it with the bad data. “What we wanted to think about is what the stars and galaxies looked like above the atmosphere,” he said, and to make sure the images matched up even when they were taken under different conditions.
Lang created “The Tractor,” a so-called “inference-based” model of the sky, to compare with data for the shape and brightness of objects imaged by different surveys and to select the best fit. The Tractor drew heavily upon supercomputer resources at Berkeley Lab’s NERSC to process the Legacy Imaging Surveys’ data and ensure its quality and consistency.
It was Lang, too, who recognized the potential popularity of the viewing tool created for the imaging data—which was adapted from street-mapping software—and brought it to the public as the Sky Viewer interactive map.
The viewing tool, he noted, was originally used by DESI researchers to check data discrepancies in the surveys’ images. It “transformed the way our team interacted with the data. It suddenly felt a lot more real that we could just scroll around the sky and explore individual problems with our data. It turned out to be surprisingly powerful.”
Imaging data from 3 surveys seeds other science research
Arjun Dey, the DESI project scientist for the National Science Foundation’s NOIRLab, which includes the Kitt Peak National Observatory site where DESI is situated, was a major contributor to two of the three imaging surveys, serving as the lead scientist for the Mayall z-band Legacy Survey (MzLS) carried out at Kitt Peak, and as co-lead scientist with Schlegel for the Dark Energy Camera Legacy Survey (DECaLS) carried out at a NOIRLab site in Chile.
The third DESI-preparatory survey, known as the Beijing-Arizona Sky Survey or (BASS), was conducted at Kitt Peak and supported by an international collaboration including the Chinese Academy of Sciences and the University of Arizona.
Researchers from China made more than 90 trips to Kitt Peak to carry out observations for BASS, which was supported by an international collaboration including the National Astronomical Observatories of China (NAOC) and the University of Arizona. “A joint research team of more than 40 people from 11 institutes in China and the U.S. participated in BASS and contributed to the success of this data release,” said Hu Zou, an astrophysicist at the Key Laboratory of Optical Astronomy in Beijing and a co-lead investigator for BASS. “This team will also play an important role in the future of the DESI survey and related sciences,” he added.
The MzLS survey, meanwhile, featured a rebuilt camera designed to see the infrared light emitted by distant, faint galaxies. Equipped with four large, ultrasensitive light-capturing sensors, called CCDs, the MzLS survey camera produced images of galaxies 10 times fainter than those sampled in a previous survey. DESI itself is outfitted with very similar CCDs that enable it to capture light from objects up to 12 billion light-years away, and both sets of CCDs were developed at Berkeley Lab.
The collective effort of the three surveys, Dey said, “was one of the most uniform, deep surveys of the sky that has ever been undertaken. It was really exciting to participate.”
All of the raw data from the imaging surveys has been released to the scientific community and public. This final data release, known as Data Release 9 or DR9, has been preceded by eight other data releases. The data have already spawned several disparate research projects, including citizen science efforts that utilize the wisdom of crowds.
Dey, along with Schlegel, is a part of a research effort that uses a machine-learning algorithm to automatically identify light-bending phenomena known as gravitational lenses in the DESI surveys data, for example.
Aaron Meisner, a NOIRLab researcher and DESI participant, is also involved in the lensing study and in a citizen science project called Backyard Worlds: Planet 9, which calls for the general public’s help in finding a possible ninth planet in our solar system by studying space images. Participants have already found numerous new brown dwarfs, which are small, cold stars unable to sustain fusion burn.
Galaxy Zoo, another citizen science project, opens up DESI’s DECaLS survey data to the public to get help with galaxy classifications.
“The imaging data provides a deep resource that is essential to carry out DESI’s unique mission while giving the scientific community access to an extraordinary dataset,” said DESI Director Michael Levi, a senior scientist at Berkeley Lab. “We look forward to using these imaging data to yield new clues and reveal the secrets of our expanding universe.”
3 sky surveys completed in preparation for Dark Energy Spectroscopic Instrument
Provided by
Lawrence Berkeley National Laboratory
Citation:
Building a giant 2-D map of the universe to prepare for the largest 3-D map (2021, January 14)
retrieved 14 January 2021
from https://phys.org/news/2021-01-giant-d-universe-largest.html
This document is subject to copyright. Apart from any fair dealing for the purpose of private study or research, no
part may be reproduced without the written permission. The content is provided for information purposes only.


