A new AI algorithm developed by researchers at the Finnish Center for Artificial Intelligence is aimed at visualizing datasets as clearly as possible. The project demonstrated that the solution chosen independently by the algorithm was often very close to that most commonly favored by humans.
The human brain has an astounding ability to observe traits even from extremely large quantities of visual information. This ability is used, for example, in the study of large data masses whose content must be compacted into a form understandable to human intelligence. This problem of dimensional reduction is central to visual analytics.
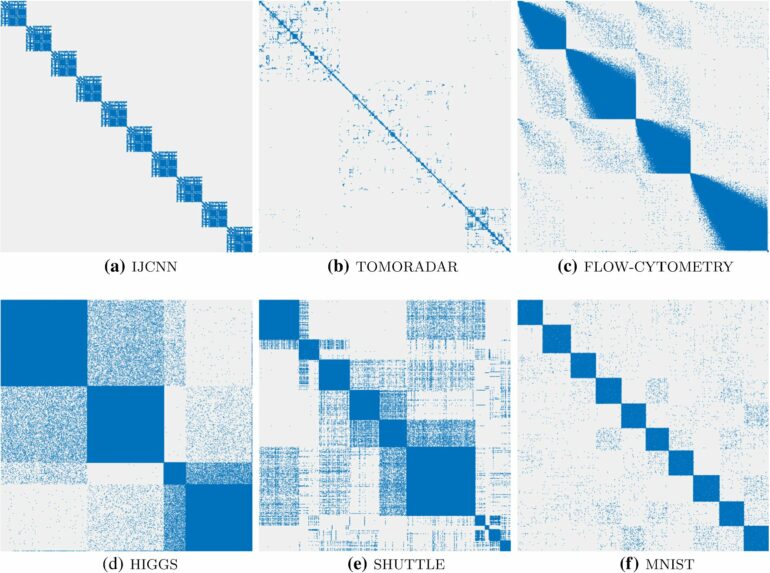
At the Finnish Center for Artificial Intelligence (FCAI), researchers affiliated with Aalto University and the University of Helsinki tested the functionality of the most well-known methods of visual analytics, finding that none worked when the amount of data grew significantly. For example, the t-SNE, LargeViz and UMAP methods were no longer able to distinguish extremely strong signals of observational groupings in the data when the number of observations was in the hundreds of thousands. The research is published in the journal Statistics and Computing.
Higgs boson data inspired creation of new algorithm
The dataset for experiments related to the discovery of the Higgs boson contains more than 11 million feature vectors, for instance.
“The visualizations drawn from them resembled a tangle of yarn, revealing none of the notable characteristics of particle behavior included in the data,” says Professor of Statistics and Probability Jukka Corander from the University of Helsinki.
“This finding provided the impetus to develop a new method that utilizes graphical acceleration similarly to modern AI methods for neural network computing.”
The AI algorithm designed by the researchers is aimed at visualization, so that data clusters and other macroscopic features, easily observed by and understandable to humans, are as distinct as possible.
In the project, several volunteers tested the technique. It turned out that the solution independently chosen by the algorithm was often very close to the solution most typically favored by humans; in this situation, human intelligence clearly distinguishes, according to personal notions, between clusters of data composed of similar observations. When applying the technique to the Higgs boson data, their most important physical characteristics were clearly highlighted.
“This is a veritable quantum leap in the field of visual analytics. Besides being several orders of magnitude faster than previous methods, our technique also is much more reliable in connection with challenging applications,” says Corander.
Under the direction of Corander’s group, a separate interface was also designed for utilizing the technique as efficiently as possible in genomics applications. This way, users can even analyze their datasets interactively by uploading files directly into the web browser. Employing global bacterial and SARS-CoV-2 datasets, this further study illustrated how the new tool can be used to quickly examine as many as millions of genomes and identify relevant characteristics.
The study was a collaboration between Professor Sami Kaski, Director of FCAI, and Jukka Corander’s group. Professor Zhirong Yang from the Norwegian University of Science and Technology served as the project lead. Professor Yang has a doctoral degree from Aalto University, and has subsequently worked as a researcher at both Aalto University and the University of Helsinki in Professor Corander’s group.
More information:
Zhirong Yang et al, Stochastic cluster embedding, Statistics and Computing (2022). DOI: 10.1007/s11222-022-10186-z
Provided by
University of Helsinki
Citation:
Artificial intelligence learns to visualize extensive datasets (2023, January 31)


