Today, users can listen to music and discover new artists, songs or albums on a variety of music streaming platforms, including Spotify, Apple Music, Amazon Music Unlimited and more. Many developers have been trying to create tools that could improve these services, such as music recommendation systems that suggest new songs or playlists to users based on their preferences and on music they listened to in the past.
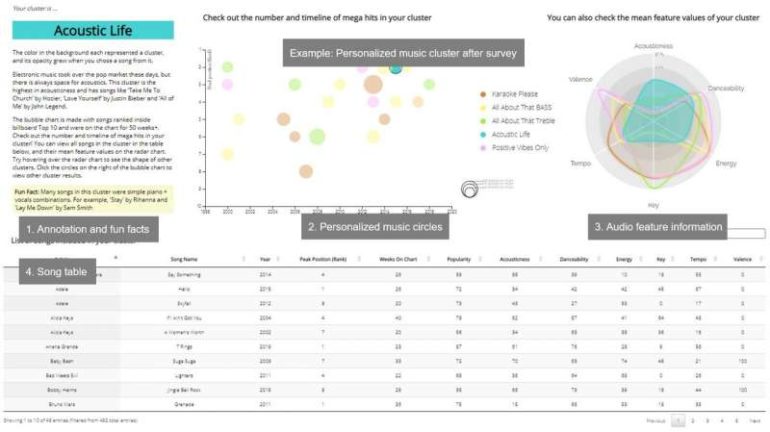
Researchers at Seoul National University recently created an interactive data visualization tool that could enhance both existing and emerging music streaming services. This tool, called Music Circles, can represent songs as unique vectors and then calculate similarities between different vectors to group similar songs into clusters.
“As music lovers with different tastes, we came together for a project that would find novel ways of visually representing and grouping abstract music data,” Seokgi Kim, Jihye Park, Kihong Seong, Namwoo Cho, Junho Min and Hwajung Hong, the researchers who carried out the study, told TechXplore via email. “We wanted to diverge from traditional ways of finding similar music through genres, artists, etc. The core idea was to represent songs with numbers by assigning embeddings based on numerical audio feature values, such as acousticness and danceability.”
The primary objective of the study carried out by Kim and his colleagues was to help users to search for music they might like and explore music streaming catalogs in ways that are more intuitive and engaging. Music Circles, the system they created, calculates the similarity between different songs by representing them as vectors, to make seeking out personalized music more entertaining.
“The sequence of interactions and visualizations in our project makes data exploration more effective and efficient,” the researchers explained. “Our visualizations, which resemble circles (hence the name), show interesting information (e.g., trends in music) based on relationships between audio features of songs.”
Essentially, Music Circles arranges songs as different cluster visualizations that match the music taste of individual users. To access song clusters aligned with their musical preferences, users simply need to take a survey about their song preferences. Music Circles uses the data collected through this survey to generate visualizations of song clusters aligned with a user’s preferences.
“We stray away from the traditional music recommendation outlook (album covers + list of songs) and provide visualizations of characteristics of certain clusters,” the researchers said.
“With appropriate annotations and carefully selected designs, we feel that the project is both enjoyable and informative. While visualization in music recommendation is scarce in general, our project highlights the fact that data visualization can make searching/browsing for music more enjoyable and effective.”
In contrast with other music recommendation systems developed in the past, Music Circles places versatile artists who produce a range of different songs into more than one cluster. For instance, if Ed Sheeran’s songs were to be recommended to users solely based on what artists they listened to in the past, his songs would only be recommended to a limited audience. Music Circles, on the other hand, places different songs by Ed Sheeran in different clusters, based on their unique attributes and characteristics, thus recommending them to a wider range of users.
In the future, the system could be used to improve music streaming services; for instance, allowing users to gain a better understanding of audio features, discover new songs they might like, view current music trends and discover what music cluster they belong to. The Music Circles framework is now available online and can be accessed at: https://musiccircles.netlify.app/ .
“As data scientists, we want to utilize underrated attributes of songs such as producers, lyricists (people who might be more related to the music than the actual artist) and provide unique music recommendations that differs from streaming powerhouses like Spotify and Apple Music,” the researchers said. “We also want to make the project scalable to big data. We would like to display a larger set of music in a more efficient manner to offer our project to more music lovers.”
Apple Music’s new Replay feature will show your most-played music of 2019
More information:
Music-Circles: can music be represented with numbers? arXiv: 2102.13350 [cs.HC]. arxiv.org/abs/2102.13350
2021 Science X Network
Citation:
Music Circles: An interactive data visualization tool that helps users discover new music (2021, March 16)
retrieved 21 March 2021
from https://techxplore.com/news/2021-03-music-circles-interactive-visualization-tool.html
This document is subject to copyright. Apart from any fair dealing for the purpose of private study or research, no
part may be reproduced without the written permission. The content is provided for information purposes only.


