Aotearoa New Zealand’s largest fault, the Hikurangi Subduction Zone (HSZ), is where the Pacific tectonic plate dives west beneath the Australian plate and underneath the east coast of the North Island.
In some parts of the subduction zone, GPS instruments are showing the plates slowly move by a few millimeters a year. This behavior is called a “slow slip” and occurs over periods of weeks or months. However, in other parts the plates are stuck, locked together, and building up pressure.
By understanding the structural factors that create the smoother slipping and stuck zones, scientists are seeking to better diagnose what areas could generate potential future earthquakes and tsunami. As Aotearoa’s largest source of potential earthquakes and tsunami, its critical to be able understand the HSZ in high-resolution detail.
New 3D images reveal hidden structures in the HSZ
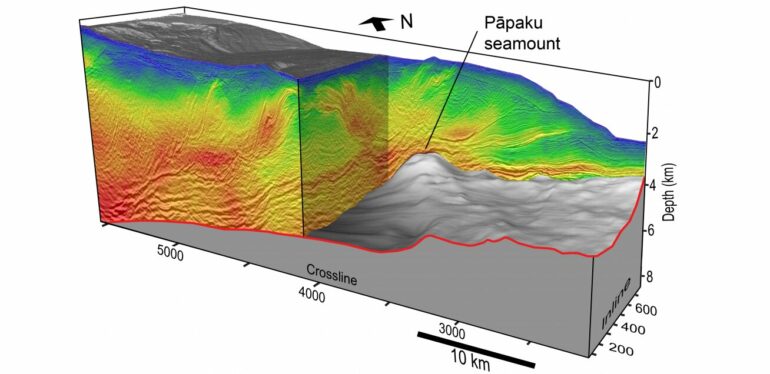
In 2018 a collaboration of researchers from U.S., Japan, UK, and GNS Science used the RV Marcus Langseth to record numerous overlapping race-track “seismic reflection data” lines. The data were gathered together alongside deployments of ocean bottom seismographs and onshore seismometer in a effort called the “NZ3D” survey.
In an international collaborative effort spanning three recent high-profile publications, the first ever spectacular 3D seismic images of the northern part of Hikurangi margin have now documented new insights for understanding the structural, stratigraphic and hydrogeologic characteristics of the HSZ.
Understanding these qualities, specifically how they transport fluids, are key to knowing the conditions that lead to generation of subduction earthquakes.
How the 3D images were created
Seismic reflection data are typically how geophysicists visualize the crust. To capture this data a specialist vessel, in this case the R/V Marcus Langseth, tows an array of individual sound sources that are tuned and combined to radiate a sound wave downward to the seafloor. The echoes that bounce back from layers in the earth are recorded on a streamer towed behind the vessel and on sensitive seismographs located onshore and on the seabed.
While a grid of 2D profiles is good enough to identify major plate boundary structures, this high-resolution 3D data are needed to visualize details within subduction zones to improve understanding of fault geometry and slip behavior. The 3D data are combined in a CAT scan image of the subduction zone that shows the architecture and properties of the boundary between tectonic plates can contribute to variability in the location of strong and seismogenic versus weak slipping segments.
The 3D data provides new constraints on the physical conditions and rock properties to inform computer simulations and forecasts of earthquake ground shaking and tsunami inundation that greatly help improved hazard preparedness and response.
How fluids and underwater volcanoes influence how New Zealand’s largest fault moves
In June 2023 a Nature Geoscience paper reports how the NZ3D data capture a seamount (underwater volcano) caught in the act of subducting beneath the shallow part of the Hikurangi margin and forms sediment lenses in its wake that appear to enhance slow slip.
Further, in a Geology paper the NZ3D data reveal a detailed map of the deeper parts plate interface that shows that it has kilometer-high hill and valleys.
The new NZ3D data show that the plate interface may strongly govern the nature of how the margin deforms, including the localization of both slow slip and hazardous fast-slip earthquakes.
Most recently, a Science Advances paper revealed a previously hidden water reservoir within the layers of the Pacific plate being swallowed up in the subduction process.
The new finding suggests that subducting plate of volcanic rocks act as amplified source of water that influences the slip behavior of the margin. The trapped water is under pressure and results in the plate boundary being weak and prone to unlocking and sliding in slow slip. The study highlights the presence of significant water delivery to slow slip source from the incoming Pacific, that were previously unknown.
“Importantly, we are able to pinpoint the location of water rich layers, that allow smooth slipping, versus other water-poor segments that are stuck and will likely rupture in fast earthquakes,” says Dr. Stuart Henrys, project lead and principal scientist, GNS Science.
Revealing the mysteries of the subduction process in ways never possible before
The hope is that these new generation 3D images will be able to identify areas of the plate boundary where water rich layers enable smooth slip and other areas that are locked and stuck.
By understanding how the slip behavior varies along the subduction zone, it allows scientists to better diagnose and pinpoint areas that are more prone to generate large earthquakes.
Our 3D data also provides new constraints on the physical conditions and rock properties to inform simulations of earthquake ground shaking and tsunami inundation that greatly help improved hazard preparedness and response.
Henrys says, “Our unique 3D seismic data, acquired offshore Gisborne along the northern Hikurangi subduction zone, is providing breakthroughs in understanding of the physical processes that control earthquakes. Globally subduction zones are where one plate dives beneath another and can rupture in devastating earthquakes and tsunami like those in Sumatra (2004) and Japan (2011).”
“These zones are also subjected to benign slow slip behavior that lasts weeks or months. Diagnosing whether slip is fast or slow along the Hikurangi subduction zone, our largest fault, will provide more reliable forecasts and assessments of the risks to vulnerable people and buildings.
“The 3D data we acquired is combined in a medical CAT scan like image providing super cool visualization of a small part of the subduction zone. For the first time we are able to map in detail the architecture and determine properties of the boundary between tectonic plates. Importantly we are able to pinpoint the location of water rich layers, that allow smooth slipping, versus other segments that are water poor, stuck and will likely rupture in fast earthquakes.
“The results represent another piece in the subduction puzzle that we can start using in large-scale earthquake cycle simulations that greatly help improved hazard preparedness and response.”
More information:
Andrew C. Gase et al, Subducting volcaniclastic-rich upper crust supplies fluids for shallow megathrust and slow slip, Science Advances (2023). DOI: 10.1126/sciadv.adh0150
Citation:
New 3D images give never-seen-before views inside New Zealand’s largest fault (2023, August 17)


