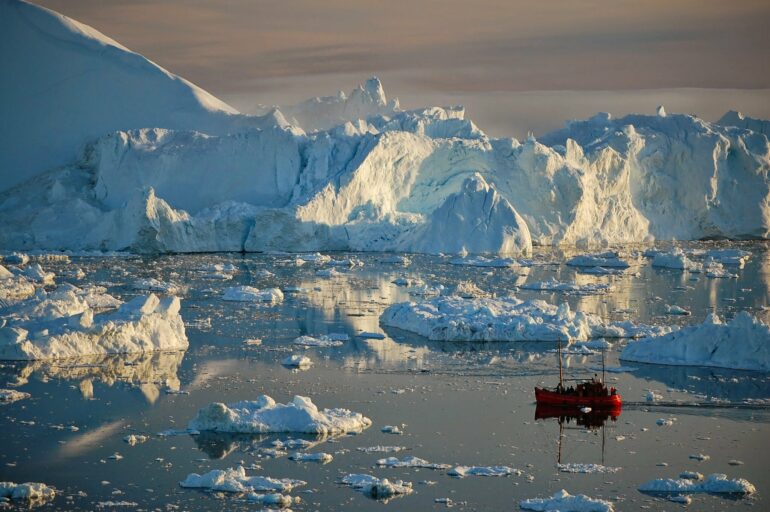
Rising sea levels from melting glaciers and ice sheets pose an increasing threat to coastal communities worldwide. A new analysis of high-resolution satellite observations takes a major step forward in assessing this risk by confirming theoretical predictions and computational models of sea-level changes used to forecast climate-change-driven impacts.
“Using sea-surface-height observations from satellites in the way we have independently verifies observations of Arctic and Greenland ice-mass loss and allows us to tease apart contributions to global sea-level rise from individual ice sheets and glacier systems,” said Sophie Coulson, a postdoctoral researcher in fluid dynamics and geophysics at Los Alamos National Laboratory. Coulson is lead author of a paper in the journal Science on detecting the “fingerprint” of sea-level change attributable to the melting of the Greenland ice sheet. “Accurately predicting regional patterns of sea-level change is absolutely central to understanding the impacts of future climate change and forecasting hazards.”
Theoretical models and computer simulations can predict sea level changes as ice sheets and glaciers melt.
“As this melting continues, and the water is redistributed around the global oceans, sea level does not rise uniformly,” Coulson said. “And since every glacier and ice sheet has a unique pattern of sea-level change, these patterns have come to be known as sea-level fingerprints. But despite over half a century of research, these fingerprints have never been unambiguously detected.”
Coulson’s search focused on satellite observations of sea-surface height in the oceans surrounding the Greenland ice sheet over the last three decades. The dominant effect in this region is that as the Greenland ice sheet loses mass, it exerts less gravitational attraction on water in the open ocean and so water migrates away from the ice sheet. This results in a lowering of sea level near Greenland, but progressively higher levels of sea-level rise outside the region.
“We predicted what the pattern of sea-level change would be around Greenland using new estimates of ice melting in the area,” Coulson said. “When we then compared this pattern to satellite observations of sea-level change the fit was remarkable. It was an incredible eureka moment for us when the team saw it—’there it is, the sea-level fingerprint!'”
Detection of the patterns has historically been hindered by the lack of sea-surface-height measurements around polar ice sheets and the variability of shorter-timescale processes, such as changing currents and ocean density. The research team on the Science paper took advantage of processed satellite observations that extend to much higher latitudes than previously possible, where the fingerprint signal is the largest. The team processed this satellite data using a powerful new technique to remove the variability due to ocean dynamics.
The new study confirms the accuracy of the geophysical predictions of sea-level change and adds confidence to projections of sea level rise across the next decades and century. As Coulson says, “It’s a powerful and sensitive approach to monitoring ice sheets and glaciers in our warming world.”
More information:
Sophie Coulson, A detection of the sea level fingerprint of Greenland Ice Sheet melt, Science (2022). DOI: 10.1126/science.abo0926. www.science.org/doi/10.1126/science.abo0926
Provided by
Los Alamos National Laboratory
Citation:
Observations confirm model predictions of sea-level change from Greenland melt (2022, September 29)


