Researchers at University of Copenhagen have developed a method to map the carbon stock of individual trees by collaborating with Rwandan authorities and researchers. Together they have created a national inventory of tree-level carbon stocks in Rwanda.
“Large uncertainties exist for the current forest assessments internationally. By mapping the carbon stock of all individual trees, accuracy is greatly improved. Further, the way different countries make their inventories is not consistent due to different contexts, goals, and available datasets. We hope that this method will establish itself as a standard, thereby enabling better comparisons between countries,” says Ph.D. Researcher Maurice Mugabowindekwe, Department of Geosciences and Natural Resources Management (IGN), University of Copenhagen. He is first author on the scientific article presenting the new method, which has been accepted for publication in Nature Climate Change.
Mugabowindekwe is Rwandan, but the choice of Rwanda for development of the method was scientifically based, he emphasizes. “The country has a rich landscape variation including savannas, woodlands, sub-humid and humid forests, shrubland, agro-ecosystem mosaics, and urban tree ecosystems which are representative of most tropical countries. We wanted to prove the method for all these landscape types.
“Moreover, Rwanda is a signatory to several international agreements on forest preservation and climate change mitigation. For instance, Rwanda has pledged to restore about 80% of its surface area by 2030 under the Bonn Challenge. So, it is highly relevant to have a reliable method for monitoring tree carbon.”
First method for mapping individual trees
Preservation of natural forests and planting of new trees are recognized as vital routes to limiting climate change. However, uncertainties regarding the carbon content of the trees have made it hard to assess the efficiency of concrete initiatives. The University of Copenhagen researchers have overcome this problem.
The new method benefits from databases that include the relationship between the extent of the crown and the total carbon content of an individual tree.
“Mapping individual trees and calculating their carbon stocks has traditionally been done in forestry, albeit at a much smaller scale. Basically, what we do equals scaling up these approaches from a very local to a national level,” says researcher Ankit Kariryaa, working 50:50 at IGN and at the Department of Computer Sciences (DIKU). Scientists from these two University of Copenhagen departments have developed the method with IGN as lead, in collaboration with other international scientists.
The new method will support Rwanda in verifying its fulfillment of commitments under schemes such as the global forestry climate change mitigation scheme REDD+ or the African Forest Landscape Restoration Initiative, AFR 100.
Many trees are found outside forests
Manually mapping the trees of an entire country would be a huge endeavor and excessively costly. Thus, the new method constitutes a breakthrough since no other method would realistically be able to provide the same information at the level of individual trees.
“It is important to take a holistic approach and also include trees which are outside forests,” says Ankit Kariryaa, noting that 72% of the mapped trees were in farmlands and savannas, and 17% on plantations.
At the same time, the relatively small proportion of trees which are found in natural forests—11% of the total tree count—comprise about 51% of the national carbon stock of Rwanda. This is possible mainly because natural forests have a very high carbon content per tree volume, thanks to very low human disturbance secured through national legislation.
“This suggests that conservation, regeneration, and sustainable management of natural forests is more effective at mitigating climate change than plantation,” Mugabowindekwe comments.
Rainforest appears to be ‘a huge green blanket’
It is paramount that the computer can distinguish the individual trees. This is because the relationship between the extent of the crown and the total carbon content of a tree is very different depending on the size of a tree. One very large tree will have a much higher carbon content than a group of trees with the same joint crown extent. So, if the group was mistaken for one tree, the carbon content would be significantly overestimated. A deep neural network is used for detecting the individual trees.
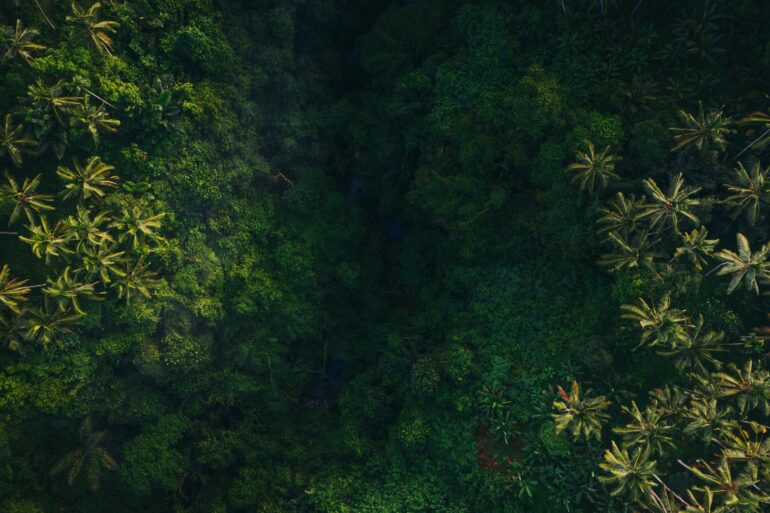
“Especially for the rainforest, it is highly challenging to determine how many different trees are present in an image. At first glance, the forest just appears to be one huge green blanket. But by using methods from machine learning and computer vision, our system can also be applied to identify the individual trees in overstory of dense forests,” explains Christian Igel, Professor of Machine Learning at DIKU.
Training the computer on verified samples is at the core of machine learning. In the Rwandan study, the computer was trained on a set of some 97,500 manually delineated tree crowns representing the full range of biogeographical conditions across the country.
The study used publicly available aerial and satellite images of Rwanda at 0.25 x 0.25 m resolution. These images were collected from June to August 2008 and 2009 and were provided by the Rwanda Land Management and Use Authority and the University of Rwanda. More than 350 million trees were mapped.
Applications beyond Rwanda
Nine researchers from the University of Copenhagen visited Rwanda in July 2022 with dual purposes of field work and the presentation of results from the first nation-wide mapping to the Rwandan authorities and other stakeholders in the country’s forestry sector.
“The presentation was well received,” reports Mugabowindekwe. He was immediately tasked by the Rwandan authorities with an updated mapping based on newer aerial images acquired in 2019. This work is now ongoing.
Further, the method has already been tested for a handful of countries besides Rwanda, including Tanzania, Burundi, Uganda, and Kenya.
“We hope countrywide high-resolution satellite imagery can also be acquired for these and more countries, to enable the application of the same approach. Also, we advocate the inclusion of funding for regular high-resolution imagery along with localized field inventory databases in development packages to enable similar works across the globe,” says Mugabowindekwe.
“The method has yielded good results when applied directly to a new country or region. If the model is further trained on a local set of samples, the accuracy becomes even higher. In my opinion, inventory of the available woody plants, their location, size, and carbon stock, is the first step towards monitoring the impact of landscape restoration efforts as well as conservation.
“If you are not able to create an accurate and reliable inventory, there is a risk of lacking a framework to track the impact of landscape restoration. This could make the conservation and sustainable management of both forests and other tree-dominated landscapes impossible. Therefore, this is science which is likely to have an impact.”
The scientific article “Nation-wide mapping of tree level carbon stocks in Rwanda” will be published in the journal Nature Climate Change.
More information:
Maurice Mugabowindekwe, Nation-wide mapping of tree-level aboveground carbon stocks in Rwanda, Nature Climate Change (2022). DOI: 10.1038/s41558-022-01544-w. www.nature.com/articles/s41558-022-01544-w
Provided by
University of Copenhagen
Citation:
Rwandan tree carbon stock mapped from above (2022, December 22)


