A new study co-led by the Smithsonian and the University of Arizona offers the most detailed glimpse yet of how Earth’s surface temperature has changed over the past 485 million years.
In a paper published Sept. 19, in the journal Science, a team of researchers, including paleobiologists Scott Wing and Brian Huber from the Smithsonian’s National Museum of Natural History, produce a curve of global mean surface temperature (GMST) across deep time—the Earth’s ancient past stretching over many millions of years.
The new curve reveals that Earth’s temperature has varied more than previously thought over much of the Phanerozoic Eon, the past 540 million years of geologic time when life has diversified, populated land and endured multiple mass extinctions. The curve also confirms that Earth’s temperature is strongly correlated to the amount of carbon dioxide in the atmosphere.
The team created the temperature curve utilizing an approach called data assimilation. This allowed the researchers to combine data from the geologic record and climate models to create a more cohesive understanding of ancient climates.
“This method was originally developed for weather forecasting,” said Emily Judd, the lead author of the new paper and a former postdoctoral researcher at the National Museum of Natural History and the University of Arizona. “Instead of using it to forecast future weather, here we’re using it to hindcast ancient climates.”
Refining how Earth’s temperature has fluctuated over deep time provides crucial context for understanding modern climate change.
“If you’re studying the past couple of million years, you won’t find anything that looks like what we expect in 2100 or 2500,” said Wing, the museum’s curator of paleobotany whose research focuses on the Paleocene–Eocene Thermal Maximum, a period of rapid global warming 55 million years ago.
“You need to go back even further to periods when the Earth was really warm, because that’s the only way we’re going to get a better understanding of how the climate might change in the future.”

Fossils in the Smithsonian’s National Museum of Natural History research collection in its Department of Paleobiology. Before this study, a reliable temperature curve for the Phanerozoic did not yet exist. This is largely due to the fragmentary nature of the fossil record. Fossil specimens offer some clues about ancient temperatures, but these are only isolated snapshots of one region at a single time. This makes it difficult to decipher what ancient temperatures looked like on a global scale. To create an accurate curve, the research team used data assimilation. Meteorologists use data assimilation to combine observations of various factors like temperature, humidity and wind speed with weather models to create more accurate forecasts. In a similar vein, the team reconstructed climatic snapshots of the world at various points across the Phanerozoic by integrating data related to ancient ocean temperatures from different parts of the planet with computer simulations of past climates. © Chip Clark.
The new curve reveals that temperature varied more greatly during the Phanerozoic than previously thought. Over the eon, the GMST spanned between 52 and 97 degrees Fahrenheit (11–36 degrees Celsius). Periods of extreme heat were most often linked to elevated levels of the greenhouse gas carbon dioxide in the atmosphere.
“This research illustrates clearly that carbon dioxide is the dominant control on global temperatures across geological time,” said Jessica Tierney, a paleoclimatologist at the University of Arizona and a co-author of the new paper. “When CO2 is low, the temperature is cold; when CO2 is high, the temperature is warm.”
The findings also reveal that the Earth’s current GMST of 59 degrees Fahrenheit (15 degrees Celsius) is cooler than Earth has been over much of the Phanerozoic. But greenhouse gas emissions caused by anthropogenic climate change are currently warming the planet at a much faster rate than even the fastest warming events of the Phanerozoic.
The speed of warming puts species and ecosystems around the world at risk and is causing a rapid rise in sea level. Some other episodes of rapid climate change during the Phanerozoic have sparked mass extinctions.
“Humans, and the species we share the planet with, are adapted to a cold climate,” Tierney said. “Rapidly putting us all into a warmer climate is a dangerous thing to do.”
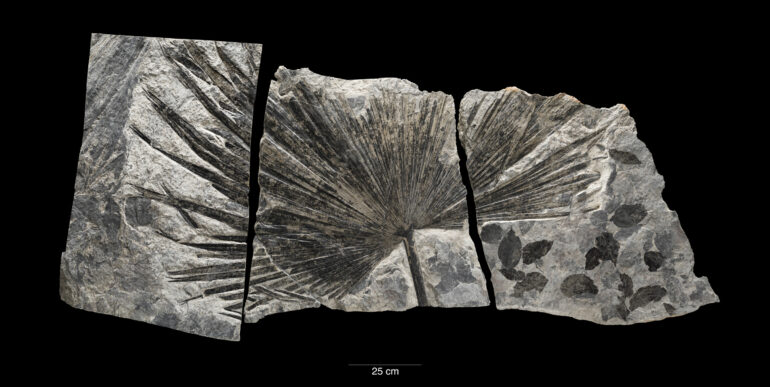
The new paper is part of an ongoing research effort that began in 2018, when Wing, Huber and other Smithsonian researchers were helping develop the museum’s “David H. Koch Hall of Fossils— Deep Time.” The new hall aimed to put the museum’s fossils in context by highlighting how Earth’s climate has changed over the past half-a-billion years. For example, several specimens—including fossilized palm fronds found in Alaska—attest to a period in Earth’s past when global temperatures were much warmer than today.
 for ancient ocean temperature that are preserved in fossilized shells and other types of ancient organic matter. © Brian Huber, Smithsonian.")
Microscopic, single-celled organisms called foraminifera have a fossil record that extends from today to more than 500 million years ago. Although each organism is just a single cell, they build complex shells around themselves from minerals in the seawater. These shells have accumulated in layers of sediment below the seafloor of the open ocean and in regions where the ocean once flooded the continents for millions of years. By examining the shell chemistry of these ancient organisms, scientists can learn about Earth’s climate long before humans ever walked the planet—and get insight into how climate changed in the past. The research team compiled more than 150,000 published data points from five different geochemical archives (or “proxies”) for ancient ocean temperature that are preserved in fossilized shells and other types of ancient organic matter. © Brian Huber, Smithsonian.
The team wanted to provide museum visitors with a curve that charted Earth’s GMST across the Phanerozoic, which began around 540 million years ago and continues into the present day. But Wing and Huber were surprised to find that a reliable temperature curve for this period did not yet exist. This is largely due to the fragmentary nature of the fossil record.
Fossil specimens offer some clues about ancient temperatures—for example, the chemistry of fossilized shells offer insights into oceanic temperatures in the distant past—but these are only isolated snapshots of one region at a single time. This makes it difficult to decipher what ancient temperatures looked like on a global scale.
“It is like trying to visualize the picture of a 1,000-piece jigsaw puzzle, when you only have a handful of pieces,” Judd said.
To produce a temperature curve across deep time, Wing, Huber and their colleagues started the PhanTASTIC (Phanerozoic Technique Averaged Surface Temperature Integrated Curve) Project.
In 2018, the museum hosted a workshop for paleoclimatologists from across the country. In 2020, Judd arrived at the museum as the PhanTASTIC Postdoctoral Fellow to lead the project.
To create an accurate curve, the PhanTASTIC team used data assimilation. Meteorologists use data assimilation to combine observations of various factors like temperature, humidity and wind speed with weather models to create more accurate forecasts.

In a similar vein, the team reconstructed climatic snapshots of the world at various points across the Phanerozoic by integrating data related to ancient ocean temperatures from different parts of the planet with computer simulations of past climates.
The team compiled more than 150,000 published data points from five different geochemical archives (or “proxies”) for ancient ocean temperatures that are preserved in fossilized shells and other types of ancient organic matter.
Their colleagues at the University of Bristol generated more than 850 model simulations of what Earth’s climate could have looked like at different periods of the distant past based on continental position and atmospheric composition. The researchers then used data assimilation to combine these two lines of evidence and create a more accurate curve of how Earth’s temperature has varied over the past 485 million years.

The “David H. Koch Hall of Fossils—Deep Time,” a 31,000-square-foot dinosaur and fossil hall at the Smithsonian’s National Museum of Natural History, takes visitors on a journey through deep time to explore ancient ecosystems, experience the evolution of plant and animal life and get up close with some 700 specimens. The new paper is part of an ongoing research effort that began in 2018, when Smithsonian researchers were helping develop the museum’s “David H. Koch Hall of Fossils— Deep Time.” The team wanted to provide museum visitors with a curve that charted Earth’s global mean surface temperature across the Phanerozoic, which began around 540 million years ago and continues into the present day. © Lucia RM Martino, Fred Cochard and James Di Loreto, Smithsonian.
While the new paper is the most robust study of temperature change to date, it is far from a finished project according to Huber, the museum’s curator of foraminifera (amoeba-like single-cell organisms) who studies microscopic fossil shells to understand environmental conditions during the Cretaceous period, the warmest stretch of the Phanerozoic.
“We all agree that this isn’t the final curve,” Huber said. “Researchers will continue to uncover additional clues about the deep past, which will help revise this curve down the road.”
In addition to Judd, Tierney, Huber and Wing, Daniel Lunt and Paul Valdes of the University of Bristol and Isabel Montañez of the University of California, Davis were co-authors on the study.
More information:
Emily J. Judd et al, A 485-million-year history of Earth’s surface temperature, Science (2024). DOI: 10.1126/science.adk3705. www.science.org/doi/10.1126/science.adk3705
Citation:
Study charts how Earth’s global temperature has drastically changed over the past 485 million years, driven by CO₂ (2024, September 19)

