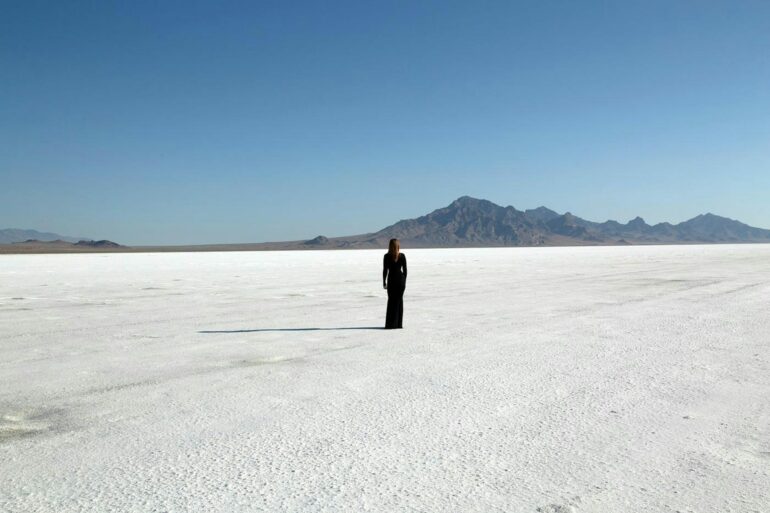
As an artist working across media, I’ve used everything from thread to my voice to poetically translate and express information. Recently, I’ve been working with another medium – geologic datasets.
While scientists use data visualization to show the results of a dataset in interesting and informative ways, my goal as an artist is a little different. In the studio, I treat geologic data as another material, using it to guide my interactions with Mylar film, knitting patterns or opera. Data, in my work, functions expressively and abstractly.
Two of my projects in particular, “points of rupture” and “tidal arias,” exemplify this way of working. In these pieces, my goal is to offer new ways for people to personally relate to the immense scale of geologic time.
Points of rupture
An early project in which I treated data as a medium was my letterpress print series “points of rupture.” In this series, I encoded data from cryoseismic, or ice quake, events to create knitting patterns.
Working with ice quake data was a continuation of my research into what I call “archived landscapes.” These are places that have had multiple distinct geologic identities over time, like mountains that were once sea reefs.
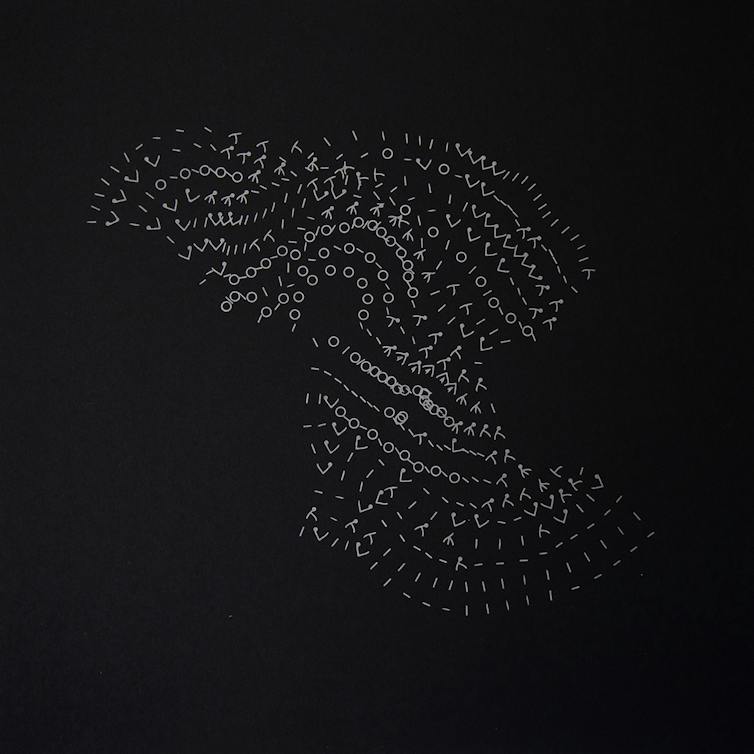
‘points of rupture (alaska glacial event 1999),’ 2020. Letterpress print of knitting pattern coded using cryoseismic data. Edition of 15. 18 x 18 in.
Sarah Nance
Because knit textiles are made up of many individual stitches, I can use them to encode discrete data points. In a knitting pattern, or chart, each kind of stitch is represented by a specific symbol. I used the open-source program Stitch Maps to write the patterns for this project, translating the peaks and valleys of seismographs into individual stitch symbols.
Knitting charts typically display these symbols in a grid. Instead, Stitch Maps allows them to fall as they would when knitted, so the chart mimics the shape of the final textile.
I was drawn to the expressive possibilities of this feature and how the software allowed me to experiment. I was able to write patterns that worked only in theory and not as physical, handmade structures. This gave me more freedom to design patterns that fully expressed the datasets without having to ensure their viability as textiles.
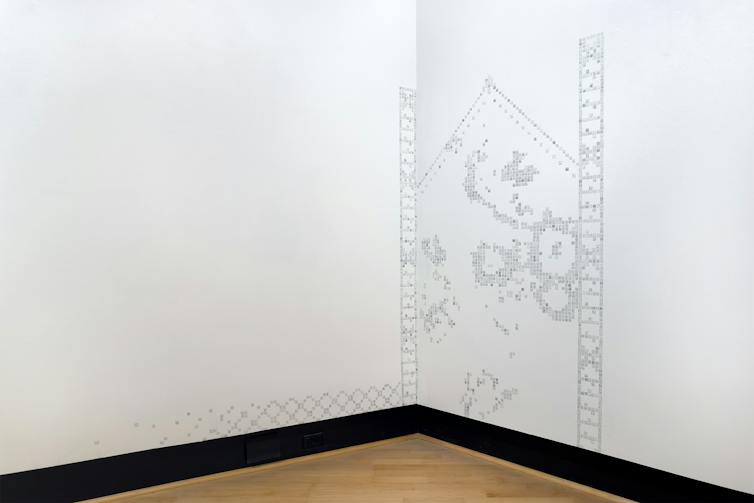
‘and when you change the landscape, is it with bare hands or with gloves? (lichen, woodwork, grate),’ 2023. Graphite drawing of selbu mitten knitting chart. 99 x 67 linear inches as installed.
Sarah Nance
Glaciers form incrementally as new snowfall compacts previous layers of snow, crystallizing them into ice. A knitted fabric similarly accumulates in layers, as rows of interlocking loops. Each structure appears stable but could easily be dissolved.
Ice quakes occur in glaciers as a result of calving events or pooling meltwater. Like melting glaciers, knitting is always in danger of coming apart – but…

