
When analyzing a set of data, one of the first steps many people take is to compute an average. You might compare your height against the average height of people where you live, or brag about your favorite baseball player’s batting average. But while the average can help you study a dataset, it has important limitations.
Uses of the average that ignore these limitations have led to serious issues, such as discrimination, injury and even life-threatening accidents.
For example, the U.S. Air Force used to design its planes for “the average man,” but abandoned the practice when pilots couldn’t control their aircraft. The average has many uses, but it doesn’t tell you anything about the variability in a dataset.
I am a discipline-specific education researcher, meaning I study how people learn, with a focus on engineering. My research includes study of how engineers use averages in their work.
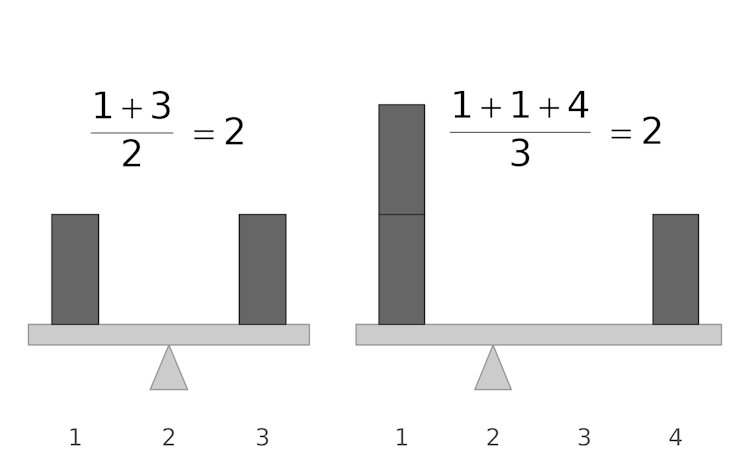
If each data point is a weight on a seesaw, with a position determined by its value, the average is the point where the seesaw will exactly balance. If there are multiple data points with the same value, you can imagine stacking weights at the same point.
Zachary del Rosario
Using the average to summarize data
The average has been around for a long time, with its use documented as early as the ninth or eighth century BCE. In an early instance, the Greek poet Homer estimated the number of soldiers on ships by taking an average.
Early astronomers wanted to predict future locations of stars. But to make these predictions, they first needed accurate measurements of the stars’ current positions. Multiple astronomers would take position measurements independently, but they often arrived at different values. Since a star has just one true position, these discrepancies were a problem.
Galileo in 1632 was the first to push for a systematic approach to address these measurement differences. His analysis was the beginning of error theory. Error theory helps scientists reduce uncertainty in their measurements.
Error theory and the average
Under error theory, researchers interpret a set of measurements as falling around a true value that is corrupted by error. In astronomy, a star has a true location, but early astronomers may have had unsteady hands, blurry telescope images and bad weather – all sources of error.

To deal with error, researchers often assume that measurements are unbiased. In statistics, this means they evenly distribute around a central value. Unbiased measurements still have error, but they can be combined to better estimate the true value.
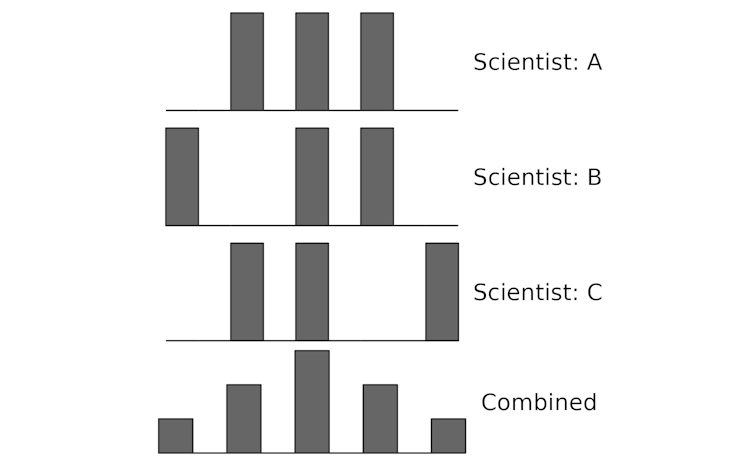
Small numbers of measurements seem random, but a large set of unbiased measurements will distribute evenly around the average.
Zachary del Rosario
Say three scientists have each taken three measurements. Viewed separately, their measurements may seem random, but when unbiased measurements are put together,…

