Graphs are essential tools for visualizing complex information, from social networks to biological pathways. However, designing these graphs can be challenging, as it involves balancing aesthetics with the practicality of automatic generation.
The Jaya algorithm, known for its simplicity and lack of need for extensive parameter tuning, has been adapted for this purpose by Dr. Fadi K. Dib, assistant professor in computer science at Gulf University for Science and Technology in Kuwait, and Prof. Peter Rodgers, a professor in the school of computing at the University of Kent in the U.K.
They have introduced a novel approach to graph drawing, a key aspect of data visualization. Their research, titled “Graph drawing using Jaya” published in PLOS ONE, explores the use of the Jaya algorithm, a method not previously applied in this field, to create clearer and more efficient graph layouts.
The study’s main contribution lies in applying the Jaya algorithm to graph drawing. This algorithm is unique because it doesn’t require the intricate setting of parameters, making it user-friendly and easy to implement. To enhance its performance, the researchers used a technique called Latin Hypercube Sampling for initializing the population of graph layouts. This method ensures a wide and effective coverage of possible layouts, leading to better results.
The effectiveness of the Jaya algorithm was tested against traditional methods like Hill Climbing and Simulated Annealing. The researchers conducted experiments using both synthetic and real-world datasets, focusing on the quality of the graph layouts and the speed of their generation. The results were clear: the Jaya algorithm outperformed the traditional methods in both the quality of the layouts and the efficiency of their production.
In addition, the study demonstrated the scalability of the Jaya algorithm, showing its capability to handle large-scale graphs, including those with up to 500 nodes. This feature is particularly important for dealing with the increasingly large datasets in today’s information-driven world.
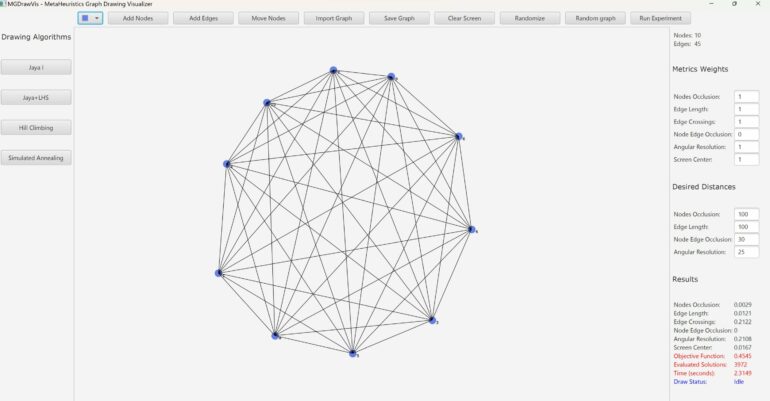
A significant contribution of this research is the development of a user-friendly visualization tool. This tool allows for easy comparison of different graph layout optimization techniques, making it a valuable resource for researchers and practitioners in the field.
In summary, the research by Dib and Rodgers marks an important advancement in the field of graph drawing. The Jaya algorithm, with its simplicity and effectiveness, offers a promising new approach for creating clear and efficient graph layouts, essential for data interpretation and analysis.
More information:
Fadi K. Dib et al, Graph drawing using Jaya, PLOS ONE (2023). DOI: 10.1371/journal.pone.0287744
Provided by
Gulf University for Science and Technology
Citation:
New research explores innovative methods in data visualization with Jaya algorithm (2023, November 20)


