Canada is facing another dangerous wildfire season, with burning forests sending smoke plumes across the provinces and into the U.S. again. The pace of the 2025 fires is reminiscent of the record-breaking 2023 wildfire season, which exposed millions of people in North America to hazardous smoke levels.
For most of the past decade, forecasters have been able to use satellites to track these smoke plumes, but the view was only two-dimensional: The satellites couldn’t determine how close the smoke was to Earth’s surface.
The altitude of the smoke matters.
If a plume is high in the atmosphere, it won’t affect the air people breathe – it simply floats by far overhead.
But when smoke plumes are close to the surface, people are breathing in wildfire chemicals and tiny particles. Those particles, known as PM2.5, can get deep into the lungs and exacerbate asthma and other respiratory and cardiac problems.
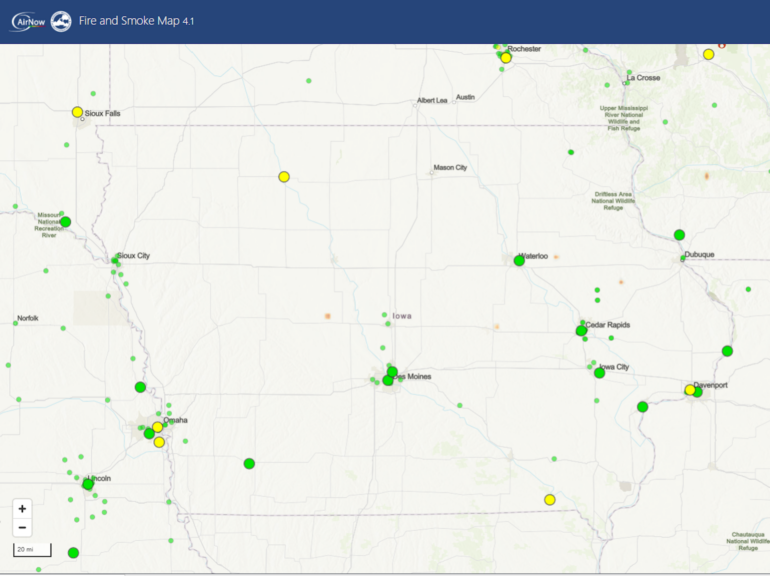
An animation on May 30, 2025, shows a thick smoke plume from Canada moving over Minnesota, but the air quality monitors on the ground detected minimal risk, suggesting it was a high-level smoke plume.
NOAA NESDIS Center for Satellite Applications and Research
The Environmental Protection Agency uses a network of ground-based air quality monitors to issue air quality alerts, but the monitors are few and far between, meaning forecasts have been broad estimates in much of the country.
Now, a new satellite-based method that I and colleagues at universities and federal agencies have been working on for the past two years is able to give scientists and air quality managers a 3D picture of the smoke plumes, providing detailed data of the risks down to the neighborhood level for urban and rural areas alike.
Building a nationwide smoke monitoring system
The new method uses data from a satellite that NASA launched in 2023 called the Tropospheric Emissions: Monitoring of Pollution, or TEMPO, satellite.

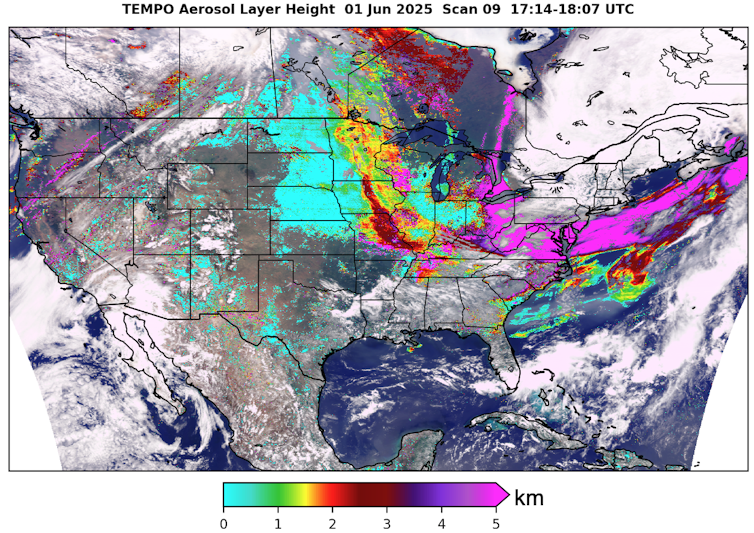
Data from the TEMPO satellite shows the height of the smoke plume, measured in kilometers. Light blue areas are closest to the ground, suggesting the worst air quality. Pink areas suggest the smoke is more than 2 miles (3.2 kilometers) above the ground, where it poses little risk to human health. The data aligns with air monitor readings taken on the ground at the same time.
NOAA NESDIS Center for Satellite Applications and Research
TEMPO makes it possible to determine a smoke plume’s height by providing data on how much the oxygen molecules absorb sunlight at the 688 nanometer wavelength. Smoke plumes that are high in the atmosphere reflect more solar radiation at this wavelength back to space, while those lower in the atmosphere, where there is more oxygen to absorb the light, reflect less.
Understanding the physics allowed scientists to develop algorithms that use TEMPO’s data to infer the smoke plume’s altitude and map its 3D movement in nearly real…

