
In 1936, some 2.4 million members of the Literary Digest magazine’s mailing list responded to its publisher by mail, in the broadest presidential candidates’ opinion poll conducted in the United States to that time. By a margin of 57 to 43, those readers reported they favored the Republican governor of Kansas, Alf Landon, over the incumbent Democrat, Franklin D. Roosevelt. The week after the election, the magazine’s cover announced in bold, black letters the message, “Is Our Face Red!”
Also: Could quantum computers fix political polls?
The following January, Oxford University’s Public Opinion Quarterly published an essay that examined how a seemingly much smaller survey of only 50,000 participants, conducted by a fellow named George Gallup, yielded a far more accurate result than did Literary Digest. Gallup’s poll was “scientific,” and Oxford wanted to explain what that meant, and why opinion polling deserved that lofty moniker.
For the first time, the Oxford publication explained a concept called selection bias. Specifically, if you don’t ask people for enough facts about themselves, you never attain the information you need to estimate whether the people around them think and act in similar ways.
The 2.4 million survey respondents, Oxford realized, were the sorts of folks who would willingly subscribe to a literary magazine. Their likelihood of owning telephones, it turned out, was much greater than for the general population — for 1936, a surprisingly narrow subset. Before long, the post mortem showed, it’d be a safe bet they were more likely to vote Republican, and proudly. What’s more, the participant count represented less than a quarter of the magazine’s mailing list, meaning about 7.6 million members did not respond. One could hypothesize that these non-respondents might have more likely to vote Democratic than the survey group but were less likely to admit as much to a literary publisher. This was a prime example of what, for the first time, was called non-response bias.
By contrast, Gallup compartmentalized his poll’s participants into groups, whose classification structure would later be dubbed demographics. He would then use mathematical weights (coefficients) as a means of balancing one group’s participation in the total poll sample, against that group’s representation in the voting population at large. With each group balanced out, he could assemble a snapshot of the entire nation based on small subsets.

Gallup’s great contribution to the science of understanding the behavior of large subsets of people, was weighting. And let’s be honest about this: Today’s neural networks and deep learning experiments like to play like they’re all about neurons and axons and deeply esoteric concepts called “perceptrons,” as though they were introduced in Star Trek along with Klingons, but they’re actually almost entirely about weighting. They’re Gallup polls on steroids. When a neural net model is trained, the values it stores trigger the adjustment of coefficient weights, which influence the degrees to which that model “perceives” successive training elements. The only significant difference is that Gallup had certain categories already in mind; by comparison, neural nets start blank, compartmentalizing along the way.
At one level, weighting is a means of neutralizing bias by making adjustments in the opposite direction. At another, it’s the injection of bias into a pattern being learned, so that a network can trigger a reaction when it recognizes the pattern elsewhere. Here, bias is your friend.
In Part 1 of this voyage of Scale, we referenced three major political elections — two in the US, one in the UK — where the offset between the predicted result and the final one was attributed by experts to bias or at least the wrong kind of bias. Statistical adjustments were being made, and history seemed to indicate such adjustments should have been the proper ones. They were just yielding disastrous results, as though the same assumptions one could make about society in 1936 no longer applied to 2015, 2016, or 2020.
In this second and final part, we examine two questions: Why shouldn’t a neural network model be considered a natural progression of the evolution of public opinion science? Secondly, why shouldn’t a quantum computer (QC) be the best-suited platform upon which to stage such an evolved model?
Say hello to Mr. P
“The Literary Digest Affair,” as it came to be known, is perhaps the most prominent, and certainly the most classic, example of the failures of non-representative polling. Mainly: If you know little or nothing about the people you’re surveying, then you’re likely to collect information only from a subgroup with particular tendencies or preferences that will likely skew your results. (The negative of this function is also true: If you know everything you need to know about the subgroup of people to whom you’re speaking, then any information you choose to give that subgroup that you’ve packaged as “news” or “truth” is more likely to be believed by them.)
Representative polling gave public opinion professionals the tools they needed to account for the disparities between the people they surveyed, and the representation of those people’s demographic groups in districts, counties, and states. And since 1936, it appeared to be working. The general trend of predictions was toward greater and greater accuracy.
Then that trend hit a wall, very loudly. As you saw in Part 1, suddenly there were several major national polls whose results differed wildly from one another, but whose aggregate failed to represent the final general sentiment of voters by any reasonable or useful amount. Researchers identified two potential causes for this phenomenon, both of which may be applicable simultaneously:
The same demographic subgroups no longer correlate with identifiable behaviors. If we indeed are a more polarized society than ever before, then the fault lines may not fall along the traditional boundaries of income, ethnicity, gender, and residency.Technology inadvertently re-introduced selection bias into the mix. The people most likely to respond to surveys today are those who are not irritated by the bombardment of invitations to participate in surveys, or the plethora of little polls one finds on Twitter or Facebook. Those of us who still tend to care from day to day may as well all be Literary Digest subscribers.
Put more simply, we don’t live in 1936 anymore. George Gallup’s breakthrough methods may not work the same way today. Thus, any more highly evolved method that’s still rooted in the concepts Gallup introduced, may not necessarily be any better. Or, as the quantum scientists told us, simply taking the same computer problem and relocating it to a bigger machine, doesn’t resolve it.
In August 2018, a team of researchers from universities in New Mexico, Tennessee, and Hong Kong trained a deep neural network with survey data from local elections in five US states and Hong Kong, whose results had already been certified. Their objective was to determine if they supplied the typical age group, household income, racial, and ideological demographics to a neural net (classical, not quantum), and fed it the same responses that real survey participants provided to professional pollsters, would the net yield better predictions?
No, not even close. On one test, their system miscalled a 2016 Florida US House of Representatives race by about 15 points. But what their experiment may have proven is this: If our assumptions are wrong about demographic correlations, then any modern approach to applying weights to compensate for what you think is selection bias, will only amplify the disparities rather than minimize them.
That theory had already been tested in 2014, by researchers including Prof. Andrew Gelman at Columbia University, in partnership with Microsoft Research [PDF]. Prior to the 2012 US national elections, they delivered a survey solely to individuals guaranteed to provide selection bias: Xbox gamers. They tended to skew male, young, and pre-graduate, compared with the rest of the country. When they applied conventional bias compensation methods to the results they received, their sample overwhelmingly favored Republican Mitt Romney over Democrat Barack Obama.
Then the Gelman team took the same responses, and applied an already well-used technique in the polling industry, but “turned it up to 11.” It’s called multi-level regression and post-stratification (MRP, or as it is affectionately referred to by pollsters, “Mister P”). Already, MRP applies regression models to small groups, compensating for selection bias. Their innovation was to make these groups much smaller. As the team explained:
Poststratification is a popular method for correcting for known differences between sample and target populations. The core idea is to partition the population into cells based on combinations of various demographic and political attributes, use the sample to estimate the response variable within each cell, and finally aggregate the cell-level estimates up to a population-level estimate by weighting each cell by its relative proportion in the population.
George Gallup would be smiling widely. At this level of application, it’s almost a manually compiled neural network. Once the Gelman team applied their highly MRP-adjusted results to the Xbox gamers’ responses, the results were. . . better. Applied to a geographic model of the country, where states’ winners receive given numbers of electoral votes, the result was a model that gave Mr. Obama an 88% chance of victory.
But that’s no better than conventional polls. This team hit the same wall. Subdividing into smaller and smaller cells buys you some accuracy, but only to a point. In a report produced by Gelman with Columbia colleagues four years later [PDF], he drew a prescient conclusion: Polling models do not account for how people and societies change. It reads in part:
In particular, the method is not currently well suited for exploring temporal changes in opinion. Existing MRP technology is best utilized for creating static measures of preferences — that is, using national surveys conducted during time t (with t representing a year or set of years) to create a single opinion estimate for each geographic unit. Though such static measures have already proven invaluable, they do not go far enough. Policymakers, the media, and scholars want to understand how and why public opinion is changing. Researchers, across a range of disciplines, need dynamic measures of the public’s preferences in order to better establish causal links between public opinion and outcomes. Political scientists, for example, may want to see whether public policy changes in response to shifting public preferences, while psychologists may want to investigate whether the mental health of lesbian, gay, and bisexual populations improve in places where public where tolerance for homosexuality is rising.
Someplace in the world, there should be a living, breathing record of people’s individual sentiments — not only their states but their changes over time, for any given time t that matters. You’d think that would have been invented by now. If a mechanism existed that was capable of subdividing Mister-P cells down to the level of single individuals, where the computational cost switched from incalculable to trivial, could the polling bias problem be effectively resolved without having to reinvent an entire branch of statistical science?
A trick of perceptron

“The question of whether quantum computers provide a speedup to machine learning computations is, at this point, unclear,” explained Dr. C. Jess Riedel, a senior quantum research scientist with NTT Research’s Physics and Informatics Lab. Speaking with ZDNet, Riedel continued:
I believe there are definitely examples where a modest speedup is known to exist for sure, which is to say, a quadratic speedup. So if it took n-squared steps on a classical computer, it would only take n steps on a quantum computer. There also exists at least a few proof-of-concept cases where quantum computers could get an exponential speedup. However, my understanding of the field is that these cases suffer from a lot of problems. They’ve been specially constructed [for] quantum computers having a big advantage, so they may not actually be interesting computations that you’d want to do.
In Part 1, we heard from quantum scientists who argued that rephrasing public opinion polls as data for QC algorithms, may not be worth bothering with. If a problem is phrased in the form of calculus rather than algorithms, then perhaps the best “speedup” (the scientific term for “acceleration”) one could hope for is only quadratic. And that’s achievable with classical machines.
The alternative is to phrase the problem as something that qualifies for exponential acceleration. Typically, political survey-based predictions are not considered algorithmic. There isn’t a cyclical process that is iteratively repeated, refining the constituent factors until a result is obtained. Yet neural networks are algorithmic. What’s more, they’re already familiar with the native context of opinion polling science: literally speaking, weights and measures.
But what Dr. Riedel is suggesting is that, while quadratic speedup missions may be too banal and unworthy of mention, exponential ones — the only alternative — may be out of the question for the foreseeable future. The rest of the machine necessary to pull off such a mission, evidently has not been invented yet. And while his own research, introduced in Part 1, suggests the next major milestone for QC production will come in 2023, as Prof. Lieven Vandersypen of Dutch quantum research association QuTech pointed out, not even a working QC can pinpoint how many qubits would be required to exponentially speed up neural net-based opinion research enough to become — to borrow Riedel’s term for it — interesting.

“The problem you’re describing, in a way, can be cast as an optimization problem,” remarked Prof. Vandersypen. “There is a lot of hope and speculation that quantum computers can help with optimization problems. But it’s not yet on very firm, scientific footing, to my knowledge.”
One way to visualize a typical optimization problem, he suggested, involves seeking the lowest point in a topological landscape. A classical algorithm would travel from valley to valley, hopping over barriers; whereas, a quantum algorithm can obtain a result as if it dug tunnels through those barriers. He went on:
In the quantum case, in principle, you can sense in multiple directions in superposition. That sounds fantastic, but it’s a bit more subtle than that. Whether you can really use quantum to speed up optimization problems — I think there’s no firm answer. . . In general, we don’t know. Which is a bit disappointing, perhaps, as a message, but OK. “We don’t know” also doesn’t mean “no.” It means people are looking at it, investigating it — there are ideas, there are speculations. The speculations have some grounds, but the jury is out.
As early as 1958, the term perceptron was coined (it’s not a misspelling; there’s an “r” where you would expect an “i”). It refers to a type of program capable of rendering differentiations, or what were sometimes called “judgments,” not through direct programming but instead by “training” — the predecessor of the process used in deep learning systems today. In some later incarnations of neural nets, the perceptron concept was revived in machine learning to refer to the digital component that “fires,” or sends a signal, when it recognizes a pattern it has learned through training.

In February 2020, the journal Nature published a paper by a team of university researchers from Hannover, Brisbane, and Cambridge, aiming to produce a formal definition of a quantum neural network (QNN). At its heart would be what this team calls a “quantum perceptron,” leveraging qubits in the input and output layers in what would otherwise be considered a simple, “feed-forward” neural layout, but borrowing their inherent capability to attain states of so-called superposition in-between 0 and 1.
“The QNN and training algorithm we have presented here lend themselves well to the coming era of NISQ devices,” the Nature team concluded. Effectively, they disagree with Prof. Vandersypen’s admonition from Part 1: Noise counteracts the efficacy of a quantum algorithm, Vandersypen stated, as you add qubits or repeat iterations. Using simulated quantum situations of two or three qubits on a classical system, the Nature team uncovered what they described as enough evidence for them to conclude that noise could be compensated for. It sounds, at least on the surface, like a promise.
Could something like a quantum perceptron produce a viable prediction based not on filled-in forms but tweets — the bits of data people share about themselves without being prompted, needled, or cajoled? Last October, researchers with the University of Georgia; the University of Wisconsin-Madison; and James Madison University in Virginia published the results of their test of “integrative modeling” of 2016 presidential election sentiment. It’s a hybrid approach that combines the type of sentiment analysis used in social media marketing, with a recurrent neural network (RNN). Rather than polling data, they used geotagged tweets attributed to Twitter users in Georgia, posted between September and November 2016. Instead of personal data, they used publicly available data about average household incomes, employment levels, and gross domestic product levels for people living in the posters’ voting regions.
Other than the content of their own comments, only their residences should distinguish them — not ethnicity, gender, or other background. Absolutely no sign of Mister P.
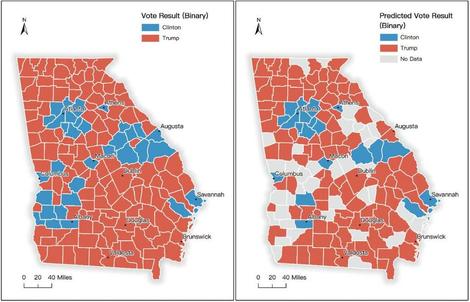
The results can be seen from space. Not every county produced enough tweets with which to make measurable judgments. The Twitter model did call Hancock and Baldwin Counties wrong (as did other major polls that year), along with Terrell County in the southwest. But among major metropolitan areas, the integrative modeling test was spot-on. If there’s a lesson to be learned here, it may be that selective bias errors can be eliminated one person at a time, even among a sampling group — for instance, people who say provocative things on Twitter — that is biased by nature.
It’s evidence of a potential solution. The question becomes, are we inclined enough to forego Prof. Vandersypen’s doubts, and pursue it?

The cost function
In the machine learning branch of AI, there’s a mathematical concept called the cost function, which is borrowed from calculus. It’s a sum of all the margins of error generated by an algorithm throughout the duration of its run, and it’s often described as cumulative. This concept has been borrowed by quantum computing as a way of judging whether, given the noise that such a system is likely to generate — the likelihood of which only increases as an algorithm becomes more iterative — the confidence level in the solution is high enough to justify running it in the first place.
If forecasting elections is a significantly simpler task for a QC than projecting the location of air molecules propelled by a hurricane within a volume of space, you might come to the conclusion that the cost function of the simpler task would weigh in its favor. Yet in a twist of fate, it turns out that a task’s ultimate simplicity may be its undoing. In other words, if a task becomes so well-designed algorithmically that it’s a piece of cake, the quantum industry may not want anything to do with it.
In September 2016, Singapore-based researchers Iordanis Kerenidis and Anupam Prakash applied themselves to the problem of re-casting how Netflix recommends new videos to customers based on their past viewing habits, as a quantum algorithm [PDF]. Their objective, even without working physical QCs, was to demonstrate how a quantum application would pierce the barrier of quantum practicality, once its algorithm was refined enough.
The way they simplified the problem was by tossing out entirely the principal, database-bound assumptions made by classical recommendation systems: namely, that groups of individual viewers may be classified as “types” based on their patterns of likes, dislikes, and disinterest. Prakash and Kerenidis wrote:
. . . From a philosophical and cognitive science perspective, it is believed that there are few inherent reasons why people buy or not a product: the price, the quality, the popularity, the brand recognition, etc. Each user can be thought of as weighing these small number of properties differently but still, his preference for a product can be computed by checking how the product scores in these properties.
In such a classical model, a “type” is a hypothetical, archetypal user with an established set of preferences, with some preferences ranking more highly than others. Each real user is modeled as a “noisy” version of one or more archetypes. “Hence, the assumption that has been implicitly made,” they wrote, “either by philosophical reasons or by modeling the users, is that there are k types of users and the users of each type ‘agree’ on the high-value elements.”
But as it turns out in practice, they continued, users whose video preferences tend to agree on the low-ranking side of the list, but disagree on the high-ranking side, end up being typecast separately by classical recommendation systems. As a result, rather than grouping viewers and making it simpler to produce recommendations, they become overly compromised, making projections exponentially more difficult.
“To great fanfare — not totally unjustifiably — [they] found an algorithm that ran exponentially faster on a quantum computer than the best-known classical algorithm,” explained NTT Research’s Dr. Riedel. “This was very exciting, and a lot of people studied it, and it led to enthusiasm about quantum machine learning.”
In place of assumptions about membership in unseen groups, Kerenidis and Prakash recommended what they called matrix reconstruction, which focused on data pertaining to each Netflix viewer individually. It was a more complex problem in terms of mathematical phraseology for human observers. However, they aimed to demonstrate that a process called quantum projection could effectively achieve the objectives of matrix reconstruction without taking the classical approach of systematically reassembling each matrix — fast-forwarding, if you will, straight to the good parts.
They may have simplified the problem too much. In May 2019, Ewin Tang, an 18-year-old graduate student at the University of Texas at Austin, produced a classical rendering of the Kerenidis/Prakash algorithm that performed at least as well — or, if slower, by an insignificant amount. With any matrix operation, sampling the matrix rather than fully processing it comes at a cost — and here is where the cost function re-enters the picture. If a matrix is effectively normalized (more evenly distributed), then it’s safe to presume a sample from a group is more representative of the whole group.
Quantum superposition introduces the strange-but-true notion that knowledge of part of a matrix, represented as qubits, yields knowledge of the rest of its contents. Tang’s insight was to substitute quantum superposition with a comparatively basic mathematical technique called ℓ2-norm sampling distribution. Yes, it might take more time to execute the classical method than the quantum method. But if you’re repeating the quantum method anyway to account for noise and error, it might not matter. Remarked Riedel:
You thought you had this speedup through quantum computing, and you did if you just considered the known classical algorithms. But it turns out that, if you thought about it a little bit harder, you could find a classical one that did just as well. This kind of thing is [indicative of] an underlying problem: You think you have a quantum advantage, when in fact, it would be much cheaper to find a better classical algorithm. It’s very rare that we have proofs that algorithms are as fast as they can be.
The Kerenidis/Prakash method fell into a kind of cost function trap, which Tang sprung. In a situation where quantum cost is reduced through algorithmic optimization, it becomes feasible to substitute a classical alternative whose cost difference, if any, is negligible. It was easier to justify the quantum advantage when the problem at hand seemed more like modeling of electrolytic substances than predicting an Iowa Senate race.
Here is the final dilemma: If the polling bias problem can be solved classically, will it? If it’s not research into some new, headline-generating mechanism whose name begins with “Q,” with backing from foundations and universities willing to pay for supercomputing time, will we, four years from now, face the same types of discrepancies and mistrust in the systems of gleaning public sentiment that ignite riots and damage governments?

Reconnoiter
We understand too little about what we think as a nation and as a people. For most of its existence, the United States was defined by the distances between its people, although enough of them believed anyway they were being bonded together by a common belief. Today, it would appear, we are being divided by our proximity. We should be a closer people, and social media had originally promised to bring us even closer. Our identities as individuals no longer map to our online profiles, or perhaps they never did and we just thought they would, because we’d grown so accustomed to filling out forms.
The relative urgency of reforming political surveys — of getting smarter about what we think we think — is a subject of somewhat muted debate. Too many incumbents benefit from maintaining our view of the future through a measured, perhaps artificial, haze. But the extent to which we’ve let the situation stagnate has led in recent days to the latest threat to democracy.
How long will public institutions and commercial organizations continue to infer your needs and wants, solely from selective samples? Will best-guess estimates indefinitely suffice for real-world evaluations? The next time candidates end up being chosen who weren’t predilected to be chosen, who gets blamed? Who gets the pointy end of the stick?
If a quantum computer isn’t better suited to the task of gauging the moods and sentiments of the people as a whole, from the massive and growing ocean of data about their moods and sentiments as individuals, then what we were told about the promise of QCs from the beginning, is wrong.
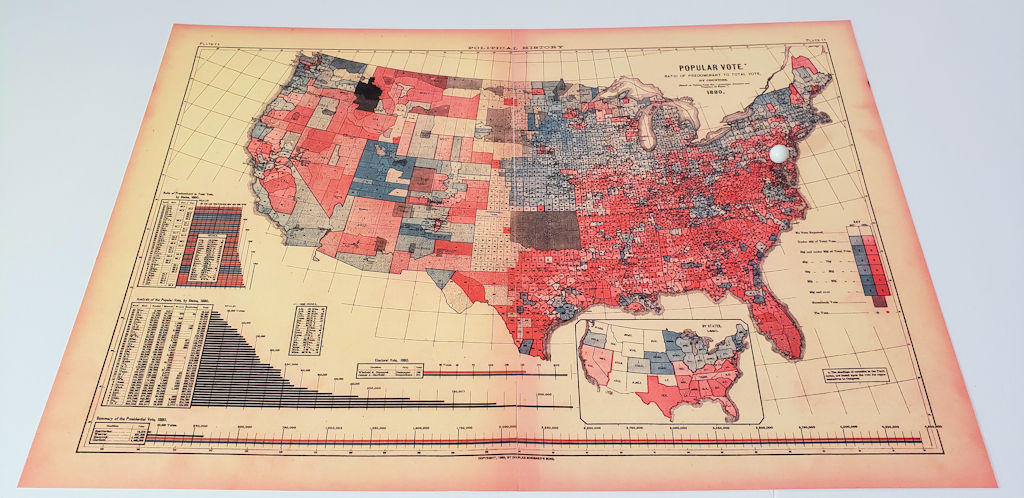
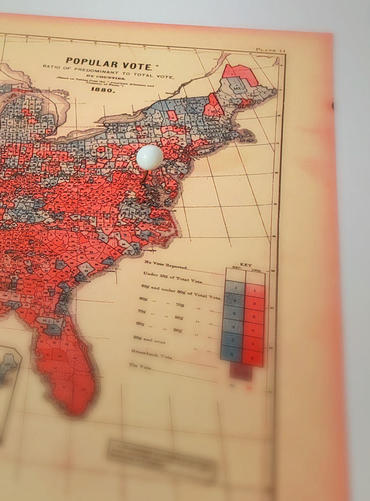
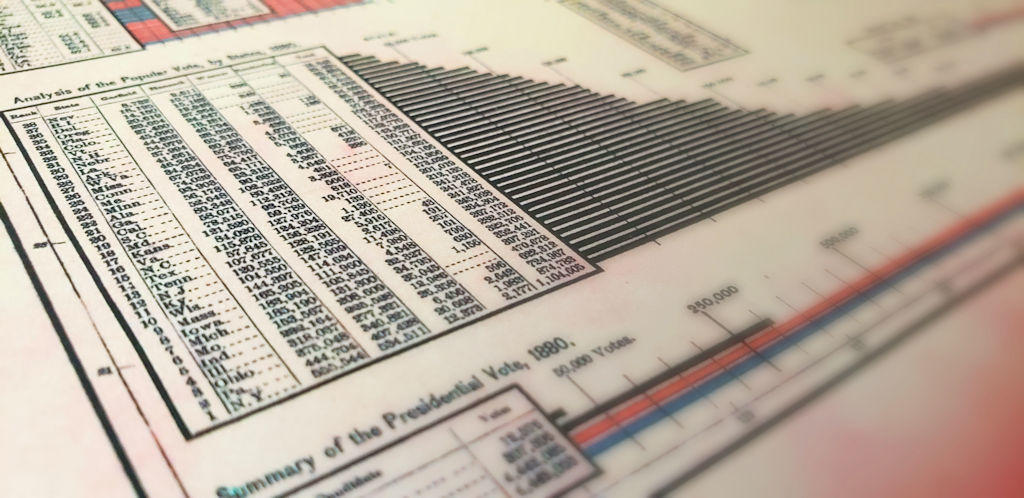
Maps for this edition of Scale were reproduced from digitized photos of plates belonging to Scribner’s Political Atlas of 1880, part of the collection of the US Library of Congress. It’s one of the first kinds of “heat maps” depicting each US county’s relative contribution to the final popular vote total that year. Note that red was used to denote prevailingly Democratic counties at that time, blue Republican.

