Northeastern experts are taking the mystery out of what we eat.
In a paper published Tuesday in Nature Food, Giulia Menichetti, senior research scientist at Northeastern’s Network Science Institute, demonstrates that the concentrations of different nutrients in food follow a fixed pattern, and that the amount of any given nutrient in a food follows a similar mathematical formula.
Inspired by these findings, her team determined that 73% of the U.S. food supply is ultra-processed, which they link to a higher risk of developing a variety of health issues. Their findings, which showed the level of processing for over 50,000 foods sold in the United States, were published in an online database for public use.
Menichetti hopes this database will help fill in gaps in the public’s knowledge about what they eat—specifically, how processed the food actually is.
The study is part of a larger project called Foodome, which was cofounded by Albert-László Barabási, Robert Gray Dodge Professor of Network Science at Northeastern and co-author of the study. Similar to what the Human Genome Project did for human genetics, Foodome seeks to map out all of the chemical components of the human diet, with the goal of better understanding how what we eat impacts our health.
“It’s really food and environment, not simply genetics, that are the major determinants of our health,” Menichetti says.
That’s a good thing, she says. Unlike our genetic makeup, diet is something over which people have control. But to do so requires knowing what’s actually in our food. That’s why Menichetti’s team is mapping the “dark matter” of food—or, the unknown chemical components that go beyond what’s listed in the nutrition facts. This could help us understand what’s in what we eat, and how much it has been processed before it reaches our plates.
What does it mean for a food to be processed—and why does it matter? Barabási says processing applies to literally anything you do to a food, like chopping up vegetables.
“That by itself is not a problem,” he says. “The problem is ultra-processing.”
For a food to be ultra-processed, he says, it must have been chemically altered. One example is some orange juices that are labeled “natural” but are actually divided into three different chemicals before being stored separately and remixed later.
There may be no indication on a package that this product is ultra-processed, he says. The USDA only tracks and reports so many nutritional components, and the FDA only requires companies to report around 12 nutrients. This is a problem because, as the team claims, there is a link between ultra-processed foods and a “higher risk of metabolic syndrome, diabetes, angina, elevated blood pressure and biological age.”
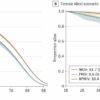
Menichetti’s findings take a step toward a better understanding of all food chemicals. In her paper, she observes that natural nutrients exhibit common patterns, well captured by a single equation.
The finding is unprecedented, Barabasi says. “The very existence of this formula was the most surprising thing,” he says. “No one has even realized that that is possible.”
Unfortunately, there’s no biomarker or chemical indicator for ultra-processed foods. But in two follow-up papers, both of which are under review, Menichetti shows that by revealing what nutrient concentrations should look like in natural, non-processed foods, the equation can still help us determine which foods in the U.S. supply have been chemically altered and thereby deviate from nutrient ranges observed in natural ingredients.
“It suggests a way to identify things that are outliers, things that do not behave in the ranges that are observed in natural ingredients,” she says. “What we observe is that ultra-processed food … is basically behaving in a way that shows extreme concentrations in many different nutrients.” For example, when an onion is fried and battered, more than half of its nutrients change in concentration; these changes correlate with the level of processing.
Knowing this, the team tried to figure out how much of the entire U.S. food supply is ultra-processed. Thanks to machine learning, Menichetti and her co-authors—Babak Ravandi, a postdoctoral researcher at Northeastern, and Dariush Mozaffarian of Tufts University—were able to do just that.
Their final task was to release this information to the public so people could make more informed decisions about their diets. The third paper, which Menichetti co-authored with Ravandi and research assistant Peter Mehler, introduces GroceryDB, a database that includes information on over 50,000 food items sold at major food retailers.
The online version of the database allows consumers to browse the food supply for the level of processing. Each food is given a score from 0 to 100, and users can compare different products. For example, Triscuits with a hint of sea salt have a score of 89, original Cheez-Its score 57, and whole wheat Ritz crackers score 29. Meanwhile, reduced fat Wheat Thins received a 3.
More information:
Giulia Menichetti et al, Nutrient concentrations in food display universal behaviour, Nature Food (2022). DOI: 10.1038/s43016-022-00511-0
Provided by
Northeastern University
Citation:
Has your food been chemically altered? New database of 50,000 products provides answers (2022, May 26)

