About 56 million years ago, volcanoes quickly dumped massive amounts of carbon dioxide into the atmosphere, heating the Earth rapidly.
This time period—called the Paleocene-Eocene Thermal Maximum, or PETM—is often used as a historic parallel for our own future under climate change, since humans have also rapidly poured carbon dioxide into the atmosphere over the last 250 years.
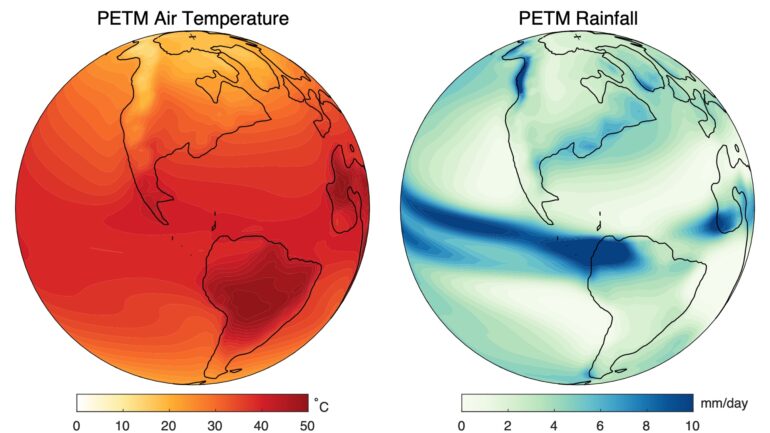
A University of Arizona-led team of researchers published a study in Proceedings of the National Academy of Sciences that includes temperature and rainfall maps of Earth during the PETM to help better understand what conditions were like in that time period and how sensitive the climate was to soaring levels of carbon dioxide.
The team, led by UArizona geosciences professor Jessica Tierney, combined previously published temperature data and climate models to confirm that the PETM is, in fact, a good indicator of what might happen to the climate under future carbon dioxide level projections.
“The PETM is not a perfect analog for our future, but we were somewhat surprised to find that yes, the climate changes we reconstructed share a lot of similarities with future predictions as outlined in the latest IPCC (Intergovernmental Panel on Climate Change) AR6 report,” Tierney said.
The long-ago time period and our future both are characterized by faster warming at the poles than the rest of the globe—a phenomenon called arctic amplification—as well as stronger monsoons, more intense winter storms and less rainfall at the edges of the tropics. The researchers also found that as more carbon dioxide is pumped into the air, the climate becomes more sensitive than previous studies predicted.
“Overall, our work helps us to understand our future under climate change better,” Tierney said. “It gives some confirmation that the basics of climate change—such as polar amplification, more intense monsoons and winter storms—are features of high greenhouse gas climates both past and future.”
Tierney and her team built their maps of the PETM by combining what’s called proxy temperature data with climate models. Paleoclimatologists like Tierney can deduce temperatures from the past by chemically analyzing certain types of fossils from a given time period. That proxy temperature data, combined with modern climate modeling technology, allowed Tierney and her collaborators to create global temperature maps of the PETM.
The climate models used by the researchers to create the maps of the past are typically used to make future climate predictions—including those in the IPCC assessment reports. Tierney and her team instead used them to generate simulations of what Earth looked like 56 million years ago.
“We moved the continents around to match the PETM and then we ran some simulations at a bunch of different levels of carbon dioxide, anywhere from three to 11 times today’s levels—or from 850 parts per million to a really high value of 3,000 parts per million—because those are all possible levels of carbon dioxide that could have occurred in the PETM,” Tierney said. “For context, carbon dioxide in our atmosphere today is about 420 parts per million and it was about 280 parts per million before the Industrial Revolution. By adding in the geological evidence, we narrowed down simulations to the ones that best matched that evidence.”
Tierney and her team have used this method in past studies to reconstruct the climate in more recent time periods.
The new study also more precisely estimates how much the globe warmed during the PETM. Previous studies suggested the PETM was 4 to 5 degrees Celsius warmer than the time period right before it. Tierney’s research, however, revealed that that number is 5.6 degrees Celsius, suggesting the climate is more sensitive to increases in carbon dioxide than previously thought.
Climate sensitivity is how much the planet warms per doubling of carbon dioxide.
“Nailing this number down really matters, because if climate sensitivity is high, then we’ll see more warming by the end of the century than if it’s lower,” Tierney said. “The IPCC AR6 predictions span 2 to 5 degrees Celsius per doubling of carbon dioxide. In this study, we quantify that sensitivity during the PETM and found that the sensitivity is between 5.7 to 7.4 degrees Celsius per doubling, which is much higher.”
Ultimately, this means that under higher levels of carbon dioxide than we have today, the planet will get more sensitive to carbon dioxide, which, according to Tierney, “is something that’s important for thinking about longer-term climate change, beyond the end of the century.”
More information:
Jessica E. Tierney et al, Spatial patterns of climate change across the Paleocene–Eocene Thermal Maximum, Proceedings of the National Academy of Sciences (2022). DOI: 10.1073/pnas.2205326119
Provided by
University of Arizona
Citation:
Maps of the past may shed light on our climate future (2022, October 11)

