If you live along one of the major interstate highways running through Chicago or directly next to Lake Michigan, you are regularly exposed to more air pollution than the rest of the city, a new Northwestern University study has found.
In the new study, Northwestern Earth scientists developed a high-resolution simulation of air pollution for the southern Lake Michigan region. The new simulation is the first to create neighborhood-scale estimates of air quality over Chicago by combining high-resolution emissions data with weather and chemical transport models to show how air and chemistry interact and move—across time and space—throughout the city and surrounding areas. Not only does this approach show where different pollutants form, it also shows how pollutants spread, interact with other gases and sunlight in the air, and change according to seasons.
The final version of the research was published in the Journal of Geophysical Research: Atmospheres.
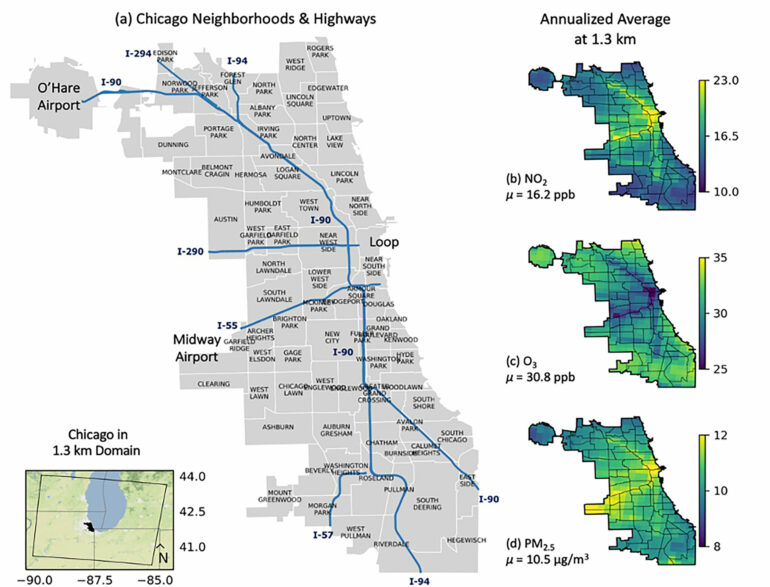
Using the new simulation, the researchers found the burden of air pollution is not equally distributed among Chicago’s communities. The researchers use their model to track three main health-hazardous pollutants: nitrogen dioxide, fine particulate matter (soot, dust and smoke) and ozone. They find that neighborhoods along I-290, I-90 and I-94 experience twice the concentration of nitrogen dioxide and particulate matter than communities with the lowest pollution in Chicago. Neighborhoods directly abutting Lake Michigan experience more ground-level ozone pollution.
By providing a detailed, neighborhood-by-neighborhood estimate of air pollution throughout the region, the researchers aim to help decision-makers find solutions—such as electrifying public transit or constructing more green spaces—for specific areas that need them most.
“Accurately characterizing air quality is really important because it affects people’s physical and mental health,” said Northwestern’s Daniel Horton, senior author of the study. “Poor air quality has a profound influence on a person’s quality of life and, ultimately, can result in people dying earlier than they should. As such, understanding where air quality is poor is critical, particularly because disadvantaged and marginalized communities have historically and unjustly borne the burden of poor air quality.”
“When we look at pollution and the impact, it’s not enough just to look at where the emissions come from,” added Anastasia Montgomery, the study’s lead author. “We need to consider the chemistry, climatology and weather conditions in the area. We can use this simulation to get a better idea of the heterogeneity of pollution across the city, which could ultimately lead to more informed and just policy decisions.”
Horton is an assistant professor of Earth and planetary sciences at Northwestern’s Weinberg College of Arts and Sciences, where he leads the Climate Change Research Group. Montgomery is a Ph.D. candidate in Horton’s research group.
, O3 (e–h), and PM2.5 (i–l) concentrations over Chicago, as simulated in the 1.3 km domain. Columns depict August 2018, October 2018, January 2019, and April 2019 simulations. Chicago-average concentrations are annotated (μ). © Journal of Geophysical Research: Atmospheres (2023). DOI: 10.1029/2022JD037942")
Monthly average NO2 (a–d), O3 (e–h), and PM2.5 (i–l) concentrations over Chicago, as simulated in the 1.3 km domain. Columns depict August 2018, October 2018, January 2019, and April 2019 simulations. Chicago-average concentrations are annotated (μ). © Journal of Geophysical Research: Atmospheres (2023). DOI: 10.1029/2022JD037942
Characterizing air quality, particularly at neighborhood scales, is challenging. The U.S. Environmental Protection Agency (EPA) continuously monitors air quality throughout the United States using a sensor network that measures various pollutants. Satellites in the atmosphere take snapshots of air quality once or twice per day. And low-cost sensor networks make non-regulatory estimates in locations where they are deployed. While all these methods gather vital information, they leave critical gaps in the data.
“On average in the U.S., there’s just one EPA monitor per 1,000 square kilometers, so that’s a pretty sparse monitoring network,” Montgomery said. “The air pollution in one city is going to be vastly different depending on whether you are standing in a park or next to a factory.
“Satellites look down through the whole atmosphere, so they can only approximate what’s happening at nose level. We wanted to fill in these gaps, enabling us to better understand who is exposed to poor air quality and whether or not exposure is equally distributed across the city.”
To fill in these gaps, Horton, Montgomery and their team used a novel emissions dataset and a coupled physics- and chemistry-based model. The physics-based model enabled the researchers to simulate how pollutants move from their source across space and time. And the chemistry-based model enabled the researchers to track secondary pollutants, such as ozone, which is formed when nitrogen oxides (NOx) and volatile organic compounds (VOCs) emissions are exposed to sunlight.
The resulting model can simulate hour-by-hour air pollution as it occurs across 1.3 kilometer-sized blocks of space. Using simulations on the 1.3-kilometer scale, the researchers resolved high-pollution areas within individual urban neighborhoods and characterized seasonal changes in ozone across small areas.
Among their findings, Horton and Montgomery noted that ozone is highest over Lake Michigan (including communities along the lake) and in rural communities. After automobiles with combustion engines emit NOx, air flow pushes pollutants away from the city. NOx is then exposed to sunlight and reacts with other chemicals, which creates ozone. Ozone levels are particularly high during warmer months when sunlight is more readily available; concentrations are halved during winter months.
The researchers also found that NOx and particulate matter levels are worst along highways—no matter the season or weather. Even when the rest of the city experiences a high pollution day, the pollution along highways still remains consistently higher than other areas.
Next, the researchers plan to explore how potential solutions, such as wider adoption of electric vehicles, might affect air pollution in the city.
“Not only can we characterize air pollution at a very fine resolution, we also can explore solutions to the problem,” Horton said. “The beauty of using a numerical model is that we can run experiments to see what solutions would improve air quality, and with this model, we can explore solutions that target those most affected.”
More information:
Anastasia Montgomery et al, Simulation of Neighborhood‐Scale Air Quality With Two‐Way Coupled WRF‐CMAQ Over Southern Lake Michigan‐Chicago Region, Journal of Geophysical Research: Atmospheres (2023). DOI: 10.1029/2022JD037942
Provided by
Northwestern University
Citation:
New study shows how Chicago pollution varies by neighborhood (2023, March 27)

