Fifty years ago, U.S. scientists launched a satellite that dramatically changed how we see the world.
It captured images of Earth’s surface in minute detail, showing how wildfires burned landscapes, how farms erased forests, and many other ways humans were changing the face of the planet.
The first satellite in the Landsat series launched on July 23, 1972. Eight others followed, providing the same views so changes could be tracked over time, but with increasingly powerful instruments. Landsat 8 and Landsat 9 are orbiting the planet today, and NASA and the U.S. Geological Survey are planning a new Landsat mission.
The images and data from these satellites are used to track deforestation and changing landscapes around the world, locate urban heat islands, and understand the impact of new river dams, among many other projects. Often, the results help communities respond to risks that may not be obvious from the ground.
Here are three examples of Landsat in action, from The Conversation’s archive.
Tracking changes in the Amazon
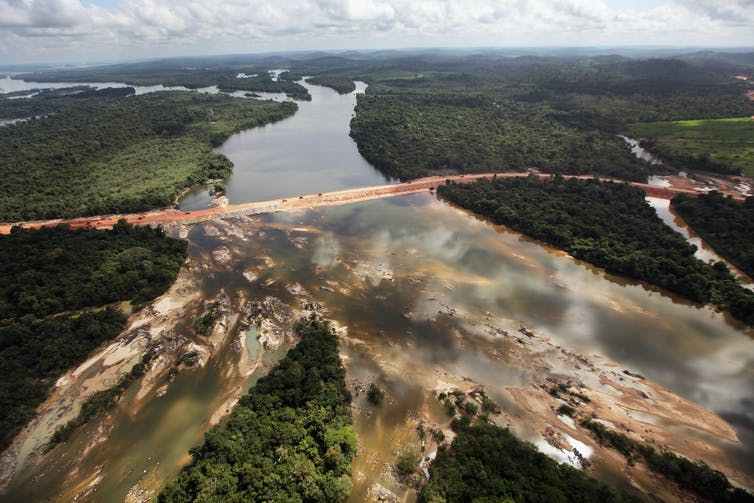
The Belo Monte Dam’s construction, shown here in 2012, flooded land and changed the river.
Mario Tama/Getty Images
When work began on the Belo Monte Dam project in the Brazilian Amazon in 2015, Indigenous tribes living along the Big Bend of the Xingu River started noticing changes in the river’s flow. The water they relied on for food and transportation was disappearing.
Upstream, a new channel would eventually divert as much as 80% of the water to the hydroelectric dam, bypassing the bend.
The consortium that runs the dam argued that there was no scientific proof that the change in water flow harmed fish.
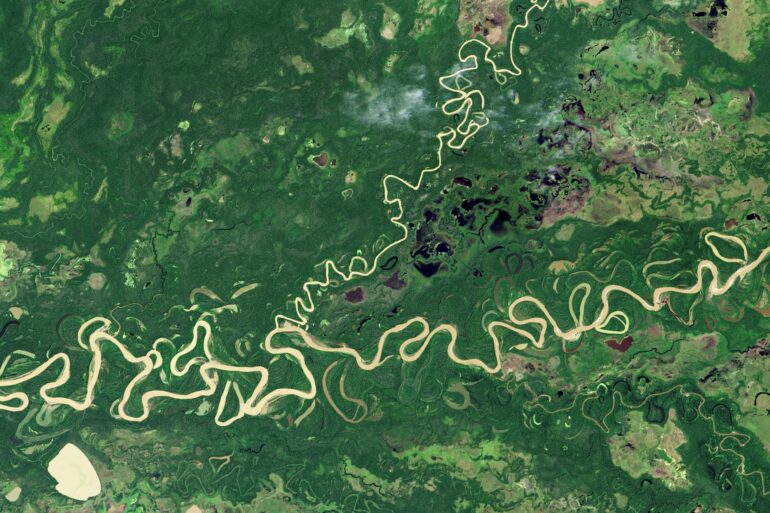
But there is clear proof of the Belo Monte Dam project’s impact – from above, write Pritam Das, Faisal Hossain, Hörður Helgason and Shahzaib Khan at the University of Washington. Using satellite data from the Landsat program, the team showed how the dam dramatically altered the hydrology of the river.
The front satellite image shows the Big Bend of the Xingu River on May 26, 2000, before the Belo Monte Dam project began. Move the slider to the left to see the same region on July 20, 2017.
“As scientists who work with remote sensing, we believe satellite observations can empower populations around the world who face threats to their resources,” Das and his colleagues write.
À lire aussi :
Satellites over the Amazon capture the choking of the ‘house of God’ by the Belo Monte Dam – they can help find solutions, too
It’s hot in the city – and even hotter in some neighborhoods

A street fan provides relief on a hot summer day in New York City.
Stephen Chernin/Getty Images
Landsat’s instruments can also measure surface temperatures, allowing scientists to map heat risk street by street within cities as global temperatures rise.
“Cities are generally hotter than…

