
The fun and games in the world of commercial open source software never stop. In the latest episodes of a long-winding saga, two more commercial open source vendors, Elastic and Grafana, changed their licenses.
The way they did it may be different, but the underlying rationale seems similar. Shay Bannon and Raj Dutt, the CEOs of Elastic and Grafana, respectively, used different wording when announcing the license change.
Bannon explicitly referred to AWS and Amazon Elasticsearch Service as the reason for the license change, while Dutt described the move as balancing value creation and revenue creation while maintaining an open-source philosophy.
There are other differences, too. Elastic transitioned to the Server Side Public License (SSPL), one that is not recognized as an open-source license by the OSI, while Grafana switched to AGPLv3, which is a bona fide open source license.
Elastic had previously filed a lawsuit against Amazon for trademark violation, and Amazon quickly responded to the license change by forking Elasticsearch — and others did, too. Grafana, on the other hand, recently entered a partnership with Amazon — a first for Amazon. Nevertheless, Dutt also referred to the need to protect Grafana.
Interestingly, all parties involved refer to “the community” as being front and center in what they do. While obviously important, however, what constitutes an open-source community, how it’s faring, and what value it generates all seem rather vaguely defined.
The people working on the CHAOSS project under the auspices of the Linux Foundation want to change that. ZDNet caught up with Georg J.P. Link, CHAOSS project co-founder, to find out more.
Enter CHAOSS
CHAOSS stands for Community Health Analytics Open Source Software. It’s a Linux Foundation project, and its roots go back 15 years ago. A research team at the University of Juan-Carlos in Madrid, Spain, was trying to understand how software is being built in open source.
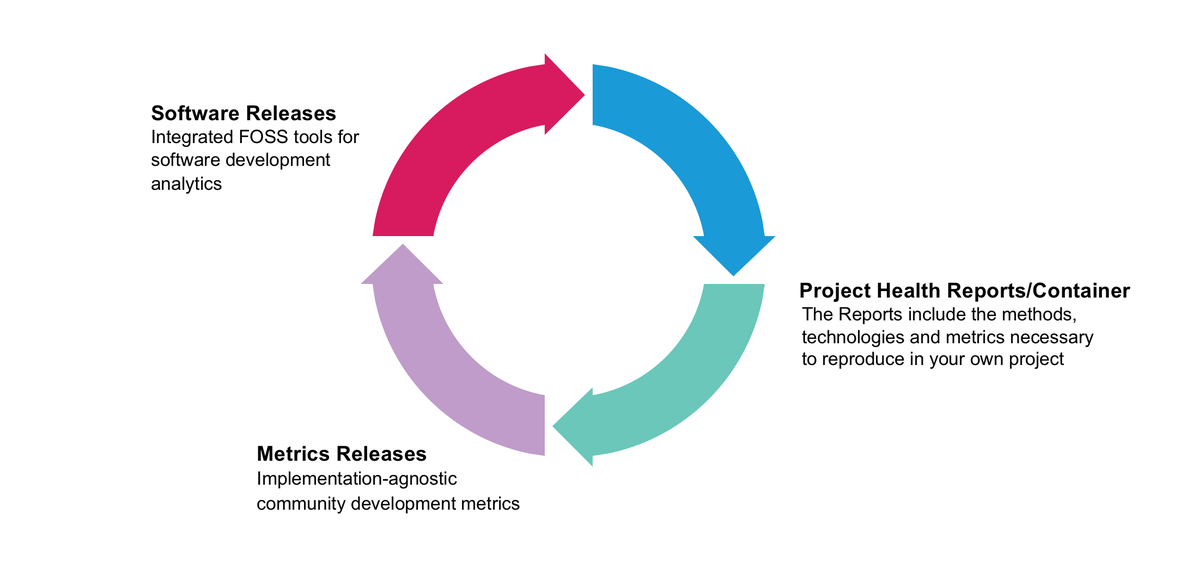
There was no tooling to help them do that, so they built their own open-source software. That was the foundation of what is now called GrimoireLab: A set of free, open-source software tools for software development analytics.
The tools gather data from several platforms involved in software development (Git, GitHub, Jira, Bugzilla, Gerrit, Mailing lists, Jenkins, Slack, Discourse, Confluence, StackOverflow, and more), merge and organize it in a database, and produce visualizations, actionable dashboards, and analytics.

CHAOSS is a Linux Foundation project focused on creating analytics and metrics to help define community health. (Image: CHAOSS project)
In parallel, a community was built around the software. In 2013, a company called Bitergia was founded to provide services around the software, as the interest in understanding how open source communities work was growing. In 2017, the CHAOSS project was adopted by the Linux Foundation, and Link joined as a co-founder.
The members involved in the project come from a variety of different organizations. Over the years, Mozilla, Eclipse, the OSI, as well as Google, Gitlab, RedHat, and VMware have been involved in one way or another.
Besides GrimoireLab, there is more software that the CHAOSS project produces. In addition, the project also promotes dissemination via initiatives such as events and podcasts. Perhaps more interestingly in the context of defining open source communities, their well-being and economic value, CHAOSS also manages a set of metrics.
A virtuous cycle of community health metrics evolution
The process of defining and managing those metrics, as Link described it, is a virtuous cycle of evolution. It started with what Link referred to as “a long laundry list” of metrics. Over time, those metrics have been grouped into categories and assigned to different working groups.
There are Common Metrics, metrics for Diversity and Inclusion, Evolution, Risk, and Value. As Link noted, defining metrics and building software happens in parallel because these activities inform each other:
“As we are coming up with new ideas for metrics, we can prototype them in software, build them out. And then also as we are building them out, we learn about the feasibility of metrics, what else we can do, get feedback from people, and then we improve our metric definition.”
Taking a quick walkthrough over metrics, we could not help but notice that some are more elaborate than others. Some metrics are raw numbers, counting things such as number of commits, number of issues, or number of people.
Granted, even seemingly straightforward metrics like those need context to be interpreted in a meaningful way. For example, the number of commits in a project may be going down, but that does not necessarily mean the project is losing steam.
On the contrary, it could mean that a different commit protocol was put in place, resulting in a smaller number of commits that aggregate more code and having higher quality. So relying on metrics alone can be deceiving — context is always needed to interpret metrics. Where it gets really interesting however is more elaborate metrics, pertaining to value.
Measuring community-related value
The CHAOSS project also includes aggregate, synthesized metrics that pull different threads together and take them to the next level. An example of such a metric that piqued our interest was the labor investment metric. The idea for this metric came from a CHAOSS conference session. Link noted:
“We said, hey, anyone interested in talk about value metrics, come and talk with us. And one of the participants was sharing how in their company they had gone and said, OK. On average, when we get a commit or when we write a commit, this is how much it costs us.
Here is all the money we spend on our engineers. Here’s the number of commits, issues, pull requests. Whatever we do in open source, we divide the number up and then we get a value for each type of contribution that we as a company make.”
The process of defining and managing open source community metrics is a virtuous cycle of evolution. (Image: CHAOSS project)
Then the question became: What if we turn this around and look at what are the contributions that we get from the community? Then it would be possible to assign a dollar value to all of these contributions and turn it into a number.
Then it would be possible to estimate — this is how much money has been invested into our open source project. And if we assume that the community has the same cost to produce the contributions as if they had been produced internally — this is what the community saved us.
That was quite interesting, Link said, because people could then go back to their managers with some evidence-based claims. They could show how much open source is saving the organization. They could show the value of investing in proper community management, in being present at conferences, in talking to people and in doing things not directly code related.
Notably, a good part of those metrics apply to open source projects just the same as they would apply to an internal software development team. It all begins with asking the right questions, which should help ensure the right metric is used to answer those questions.
Metrics and side effects
You can’t improve what you can’t measure, as an oft-quoted adage goes. Of course, the flip side of that is that measuring things can lead to optimizing for what is measured. Link referred to examples when this happened, such as people piling on pre-existing code reviews to get a piece of the value a review counts for.

There is no silver bullet to deal with this kind of thing, Link acknowledged. You just have to be on top of it, see how the community reacts, and then change your metric strategy accordingly if needed. What’s interesting, Link went on to add, is that metrics are driven by two different perspectives:
“We’ve talked about organizations wanting to have transparency into the projects, foundations wanting to have transparency about how good they are stewarding the projects and showing to their members, hey, we are taking good care of your projects. Your contributions are valued.
The other side is the communities themselves want that transparency as well. Community members like to see, hey, I’m having an impact. Look, I’m on the leaderboard. My contribution matters. And so we see this from both sides. Having these metrics helps the community.”
Besides metric gamification, there are more things to be careful about. For example, when we talk about diversity, equity and inclusion, we start dealing with personally identifiable information that can be sensitive. As Link noted, the goal of the CHAOSS project is to provide a set of metrics that can be measured, raise awareness, and give people options.
The first step is to get off zero. Adopting some metrics is better than none, and the CHAOSS project people and software are there to help. And that is a good way to come full circle to where we started from — commercial open source, the value it generates, and giving credit where credit is due.
Toward more fine-grained open-source economics?
In 2020, we wrote about an analysis based on Github commits for various commercial open source projects. What that analysis showed was that vendors backing the development of those projects were the ones contributing the majority of code.
Clearly, code is pretty central for open source. However, it’s not the only thing that generates value. Even though we barely scratched the surface of the CHAOSS project, it looks like the closest thing to an effort for holistically measuring value generated in open source projects.
Commercial open source vendors have a legitimate interest to be concerned about capturing the value they generate. Third parties like Amazon may also have a legitimate argument in claiming they contribute in ways that go beyond code.
License engineering is one way commercial open source vendors have to deal with the situation. However, it seems like a rather blunt instrument, with considerable side effects. Link noted that in terms of seeing how license changes affect the community, community metrics may help.

If makers and takers in the open-source ecosystem can’t be balanced, the ecosystem won’t be sustainable. (Image: Dries Buytaert)
In the case of Elastic, you still have the Elastic employees doing development work after that, so at least on the development side, the majority of the work continued just the same as before, he went on to add. But what if there was a better way to capture the value open source generates, and divide it more equitably, balancing makers and takers?
That is the gist of what people like Drupal Founder Dries Buytaert have suggested. Link on his part concurred — the perspectives of the open-source projects, the companies that heavily invest in research and development for those projects, and the users of the projects need to be somehow balanced:
“The place metrics come in here is takers. The companies who use open source software without being heavily involved in the development can use the metrics to see: How much value do we get? How much should we give back? That is, if they are conscious about this.
And the makers likewise can use the transparency to make a similar assessment. How much are we investing? How much does the community give back to us? License changes..that is a story, I think, outside of the community, because it’s a business interest that is being pursued here.”
So far, even if vendors have taken note, they don’t seem to have taken action. Coming up with a way to fix commercial OSS by measuring and rewarding contribution may not just benefit vendors, but point towards a more holistic and equitable way of measuring value in general.

