
The Salesforce shopping index is published quarterly, capturing real digital commerce insights from over 1 billion people. Powered by the Commerce Cloud, the shopping index uncovers the true shopping story by analyzing the activity and online shopping statistics of more than one billion shoppers across more than 51 countries, with a focus on 11 key markets: US, Canada, UK, Germany, France, Italy, Spain, Japan, Netherlands, Australia, New Zealand and the Nordics. The Q1 2021 Shopping Index was based on analysis of 1,989 digital commerce sites, 1.2 billion shoppers, 22 billion visits across 51 countries.
Here are some the key takeaways regarding digital commerce trends based on the Q1 2021 Shopping Index:
Global digital traffic year-over-year grew by 27% Global digital commerce year-over-year grew by 58% — U. S. grew by 45% YoY, Netherlands by 108%, Canada by 111%, UK by 91% and Germany by 61%Global shopper spend year-over-year grew by 31%
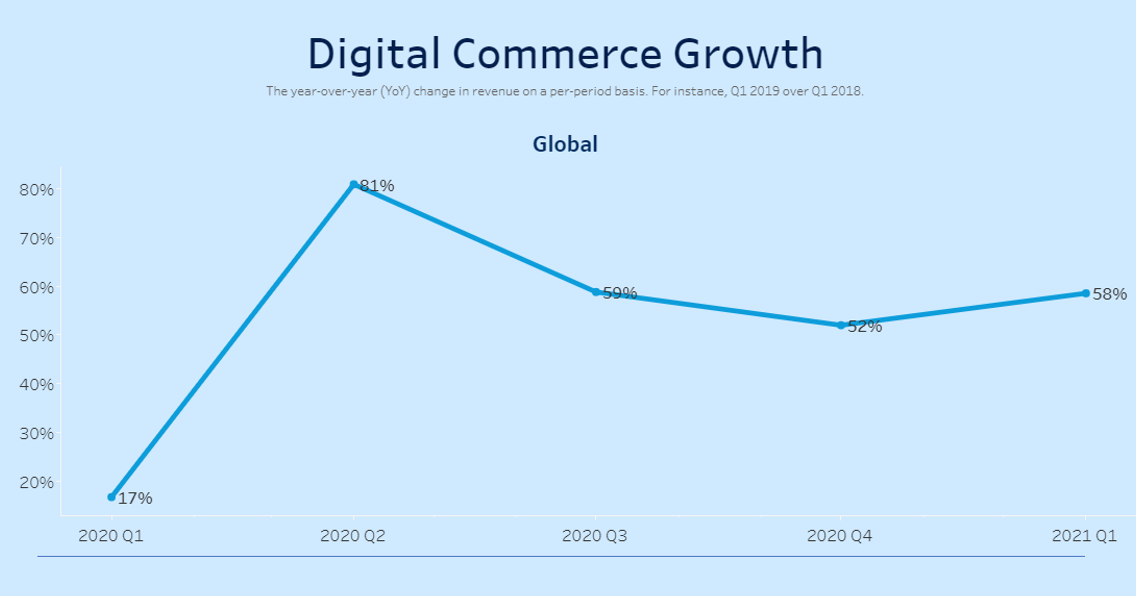
Digital commerce growth – global YoY growth of 58%
Global traffic growth by device shows a 28% YoY growth in computer usage and 29% YoY growth with mobile devices. Global traffic grew by 27% YoY. In the U.S. the traffic grow was +24%.
Global order growth by device shows a 34% YoY growth for computers and 59% growth for mobile devices. Mobile e-commerce is continuing to grow at very high rates. Overall, global orders grew by 46% YoY across all device types.
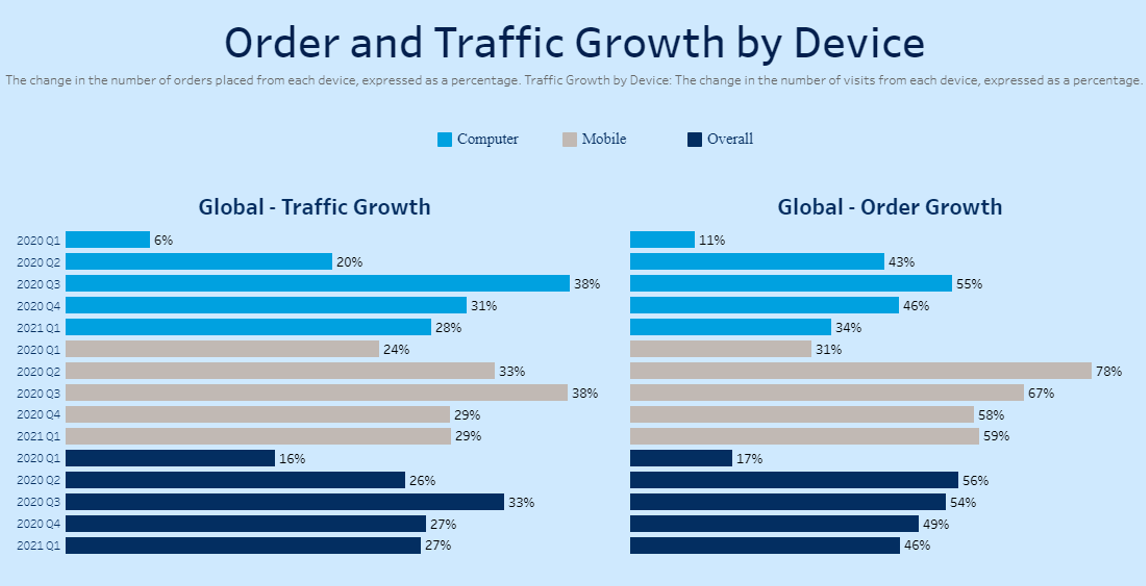
Order and traffic growth by device
Search usage saw moderate growth in Q1. Only 8% of online shopping sessions utilized the site’s search bar. That said, 24% of all revenue comes from shoppers who utilize the site search bar during their shopping session — in the U.S., 20% of revenue come from search usage.
Globally, the order and traffic share by device varied by region but grew across other geographies. Mobile represents 69% of traffic share and 57% of all orders. Clearly, businesses need to optimize the e-commerce experience for the mobile user.
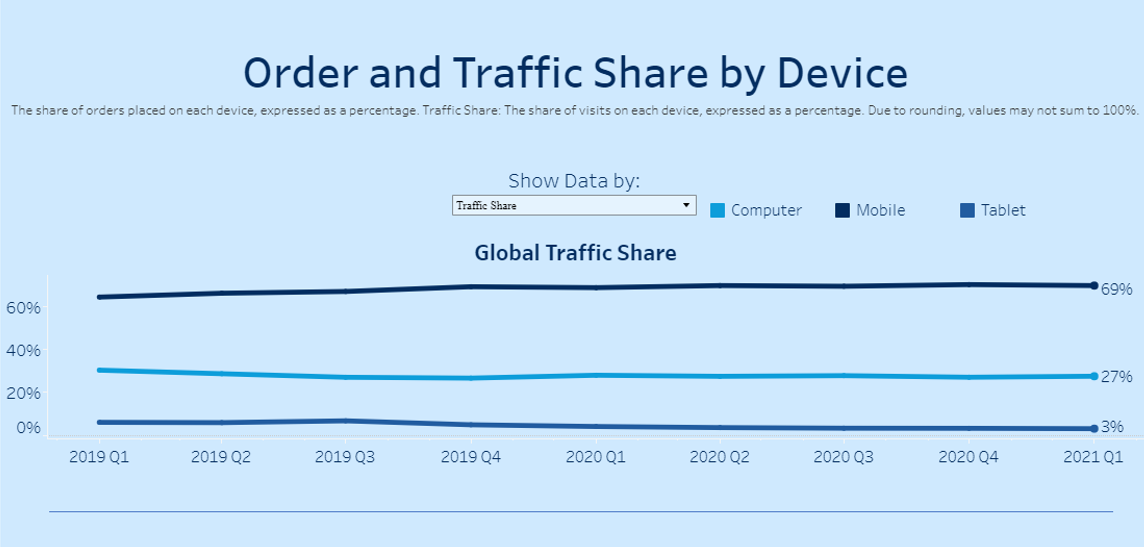
Share of traffic for e-commerce is dominated by the mobile buyer.
E-commerce conversion rates vary by country. The highest conversion rate is from the U.K. at 3.5%. The lowest digital commerce conversion rate is in Spain at 1%. U.S. conversion rate for Q1 2021 was 2.5%. Use of machine learning and AI-powered commerce applications with better personalization and visual commerce with use of augmented reality (AR) and interactive 3D powered applications can improve conversion rates. Analytics to capture abandoned cart scenarios and improved user experience throughout the commerce buying journey, powered by CRM marketing, commerce and data visualization combined capabilities can improve conversion rates.
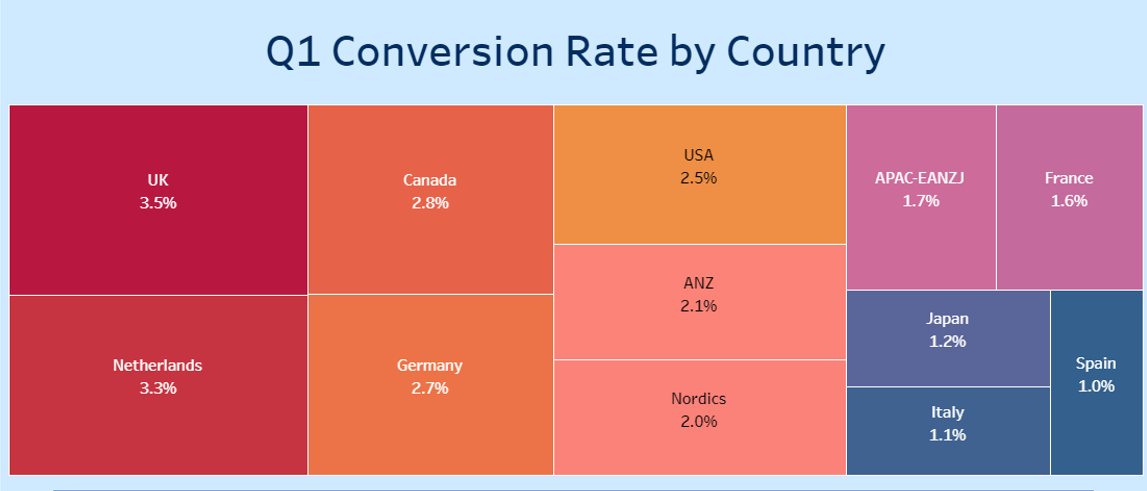
E-commerce conversion rates by country – 2021 Q1

Global cart abandon rates was 87% in 2021 Q1. Mobile abandon rates was 93%. In the U.S., mobile abandon rate was 94%.
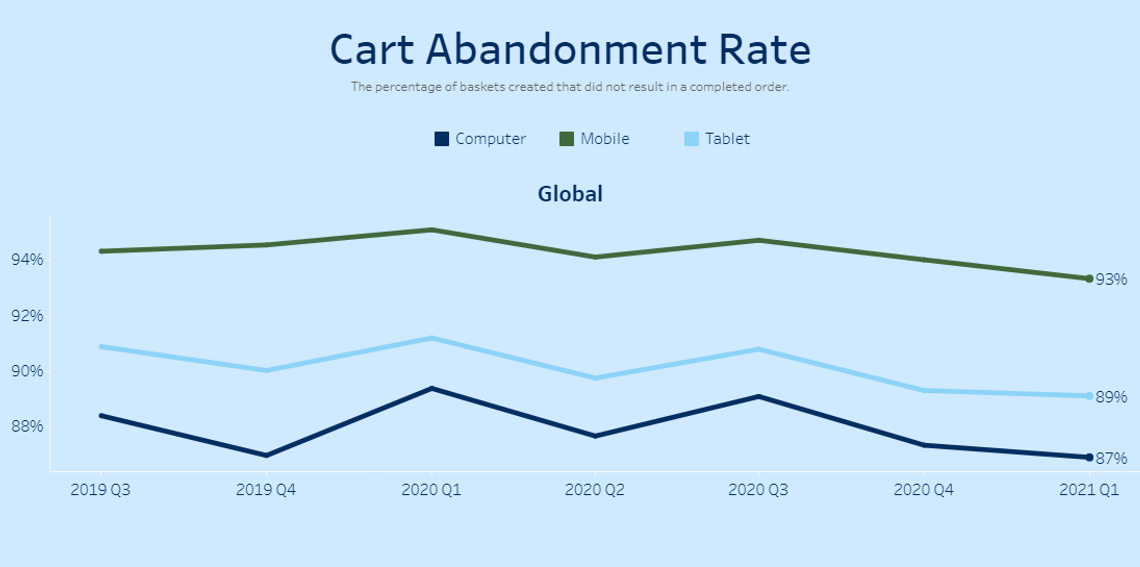
Cart abandonment rates – Global 2021 Q1
The share of visits where the referring source is a social media platform grew in Q1 2021. Globally, 9% of visits came from a social network. On tablets, we saw a 13.9% share of visits from social, and 11.8% from mobile (smartphones). In the U.S., tablet share of visits from social was 19% and 12.4% on smartphones.
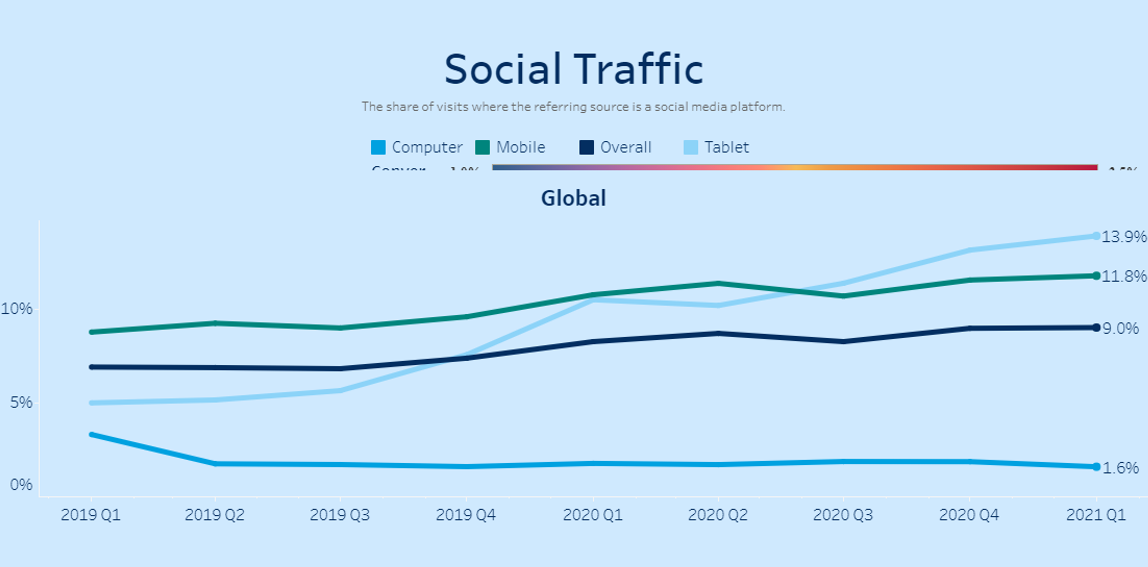
Social traffic and digital commerce – Q1 2021
The 2021 Q1 Shopping Index also includes shopper spend — the per visit average amount spend by shoppers — and average order value (AOV) and discount rates. AOV is the order amount spent by the shopper. Globally, discount rates were at 18% in Q1 2021 (17% in the U.S.), the lowest discount rates in more than two years.
To learn more about the Salesforce 2021 Q1 Shopping Index report, you can visit this interactive Tableau powered website here.

